Open Access
Fig. D.4.
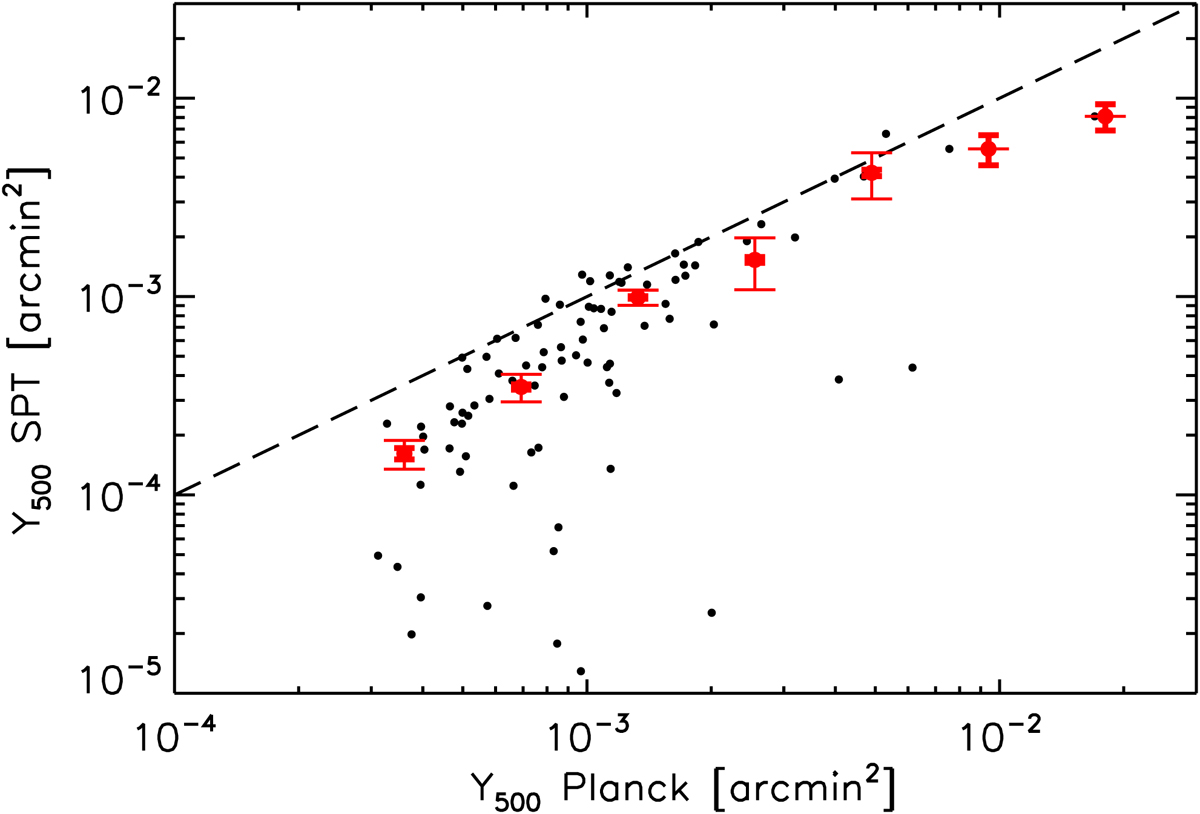
SPT fluxes of PSZ2 clusters as a function of PSZ2 flux. This is the same figure as Fig. 2, except that we used the XMM-Newton prior to fixing the filter size, instead of the blind PSZ2 size, for both the Planck fluxes (x-axis) and SPT fluxes (y-axis).
Current usage metrics show cumulative count of Article Views (full-text article views including HTML views, PDF and ePub downloads, according to the available data) and Abstracts Views on Vision4Press platform.
Data correspond to usage on the plateform after 2015. The current usage metrics is available 48-96 hours after online publication and is updated daily on week days.
Initial download of the metrics may take a while.