Fig. D.2.
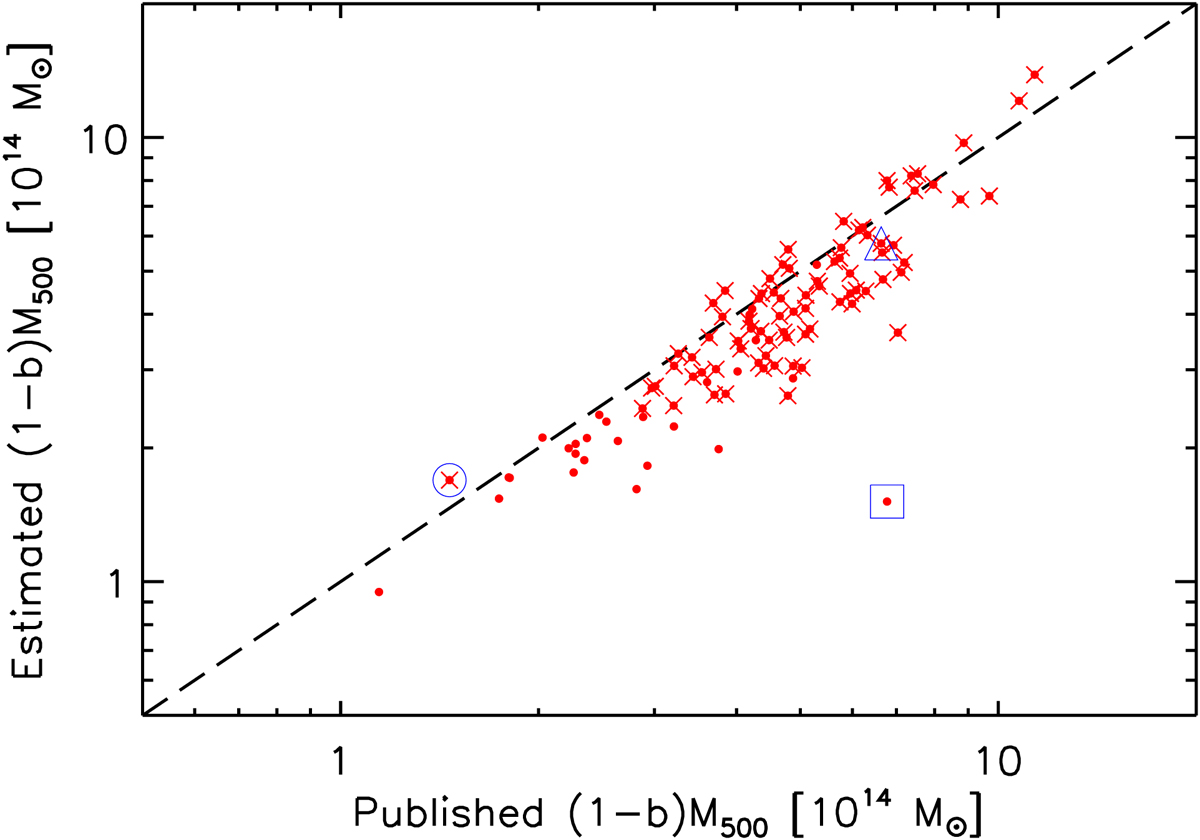
Extracted masses versus published PSZ2 masses for the joint detections matched to PSZ2 clusters. This figure is the same as Fig. 8, but we additionally marked the clusters that are both matched to SPT-SZ and PSZ2 clusters with red crosses as in Fig. D.1. We also marked the main outlier with a blue square. The blue circle and upward triangle, which are outliers in Fig. D.1, are not outliers in this figure.
Current usage metrics show cumulative count of Article Views (full-text article views including HTML views, PDF and ePub downloads, according to the available data) and Abstracts Views on Vision4Press platform.
Data correspond to usage on the plateform after 2015. The current usage metrics is available 48-96 hours after online publication and is updated daily on week days.
Initial download of the metrics may take a while.