Fig. C.3.
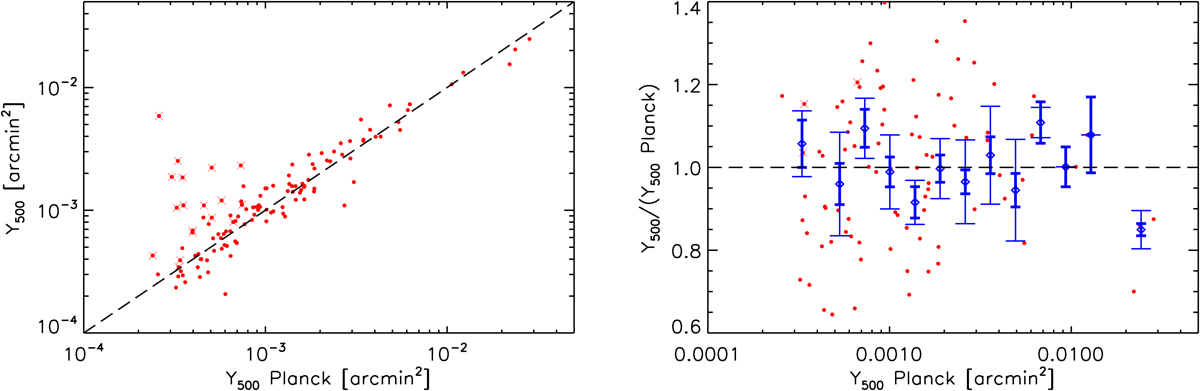
Left: blind flux Y500 of the Planck clusters extracted from the public Planck data as a function of the blind flux Y500 Planck published by the Planck collaboration (Planck Collaboration XXVII 2016a). Red dots are individual clusters. There is overall agreement, but some clusters show deviations from the equality line. They correspond to clusters having blind sizes deviating by more than a factor of two from the values published by the Planck collaboration and are marked as red crosses (see also Fig. C.2). Right: ratio of the two flux values as a function of the flux published by the Planck collaboration. The ratio is consistent with unity. Blue diamonds are weighted averages. Thick error bars display 68% statistical errors, and thin error bars show 68% errors obtained by the bootstrap method.
Current usage metrics show cumulative count of Article Views (full-text article views including HTML views, PDF and ePub downloads, according to the available data) and Abstracts Views on Vision4Press platform.
Data correspond to usage on the plateform after 2015. The current usage metrics is available 48-96 hours after online publication and is updated daily on week days.
Initial download of the metrics may take a while.