Fig. C.2.
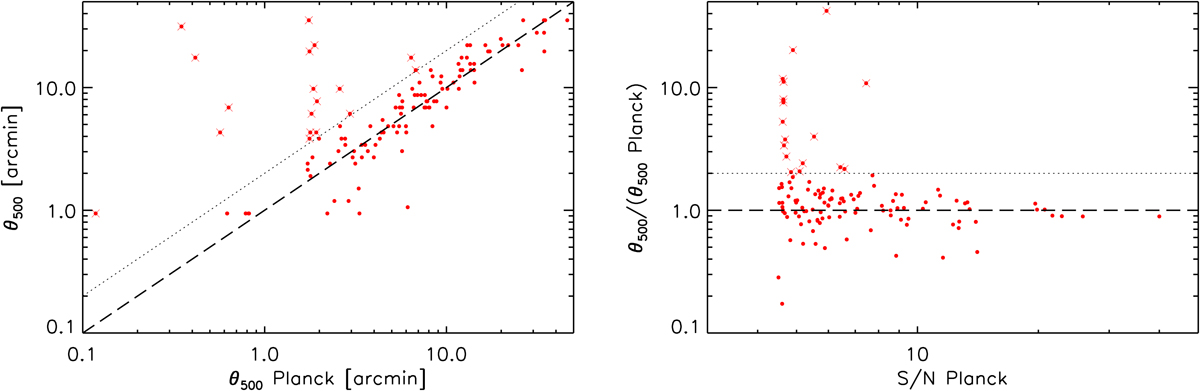
Left: blind size θ500 of the Planck clusters extracted from the public Planck data as a function of the blind size θ500 Planck published by the Planck collaboration (Planck Collaboration XXVII 2016a). Red dots are individual clusters. There is overall agreement, but some clusters show deviations larger than a factor of two. They are marked with a red cross. The dotted black line delineates the deviation by a factor of two. Right: ratio of the two size values as a function of the S/N published by the Planck collaboration. The deviating clusters are mainly located at the lower S/N, for which the blind size estimation is uncertain.
Current usage metrics show cumulative count of Article Views (full-text article views including HTML views, PDF and ePub downloads, according to the available data) and Abstracts Views on Vision4Press platform.
Data correspond to usage on the plateform after 2015. The current usage metrics is available 48-96 hours after online publication and is updated daily on week days.
Initial download of the metrics may take a while.