Fig. C.1.
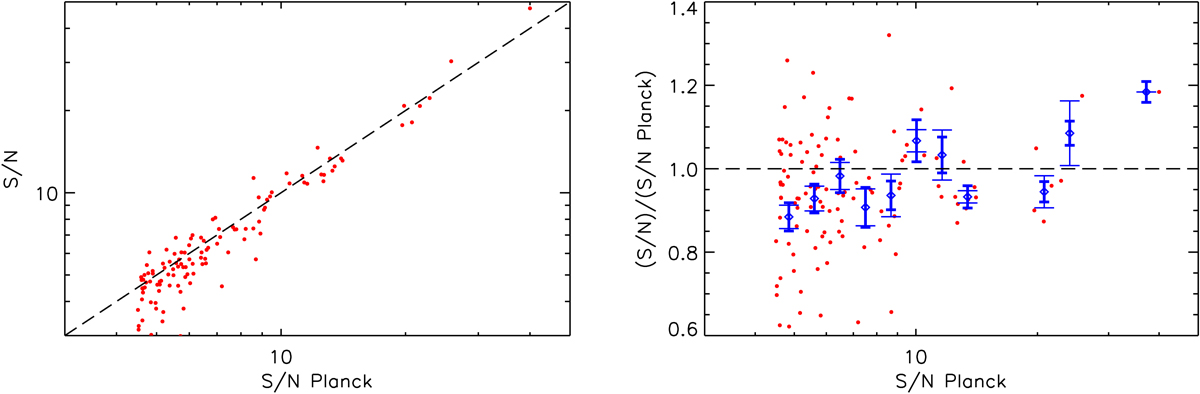
Left: S/N of the Planck clusters extracted from the public Planck data as a function of the signal-to-noise S/N Planck published by the Planck collaboration (Planck Collaboration XXVII 2016a). There is overall agreement, but also a large scatter between the two measurements due to the upgraded pixel size, the change of coordinate system, and the change in the point-source masking procedure. Right: ratio of the two signal-to-noise values as a function of the signal-to-noise published by the Planck collaboration. Red dots are individual clusters. Blue diamonds are weighted averages. Thick error bars display 68% statistical errors, and thin error bars show 68% errors obtained by the bootstrap method.
Current usage metrics show cumulative count of Article Views (full-text article views including HTML views, PDF and ePub downloads, according to the available data) and Abstracts Views on Vision4Press platform.
Data correspond to usage on the plateform after 2015. The current usage metrics is available 48-96 hours after online publication and is updated daily on week days.
Initial download of the metrics may take a while.