Fig. B.3.
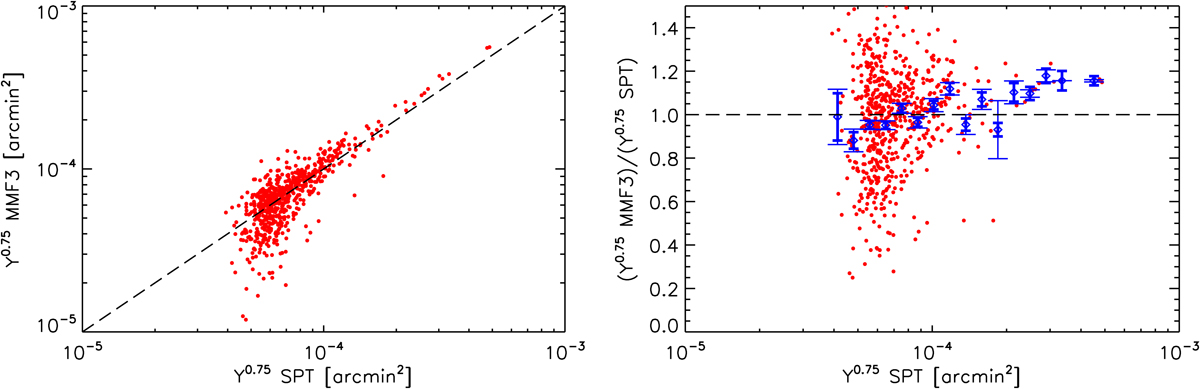
Left: blind SZ flux of the SPT clusters extracted from the public SPT data with our modified MMF3 algorithm as a function of the SZ flux Y0.75 published by the SPT collaboration (Bleem et al. 2015a). There is good agreement at low flux, but our flux is systematically overestimated at high values (Y0.75 SPT > 2 × 10⁻⁴ arcmin2). Right: ratio of the two flux values as a function of the flux published by the SPT collaboration. Our flux is in good agreement for Y0.75 SPT < 2 × 10⁻⁴ arcmin2, but it is on average 1.1 times Y0.75 SPT for Y0.75 SPT > 2 × 10⁻⁴ arcmin2. Red dots are individual clusters. Blue diamonds are weighted averages. Thick error bars display 68% statistical errors, and thin error bars show 68% errors obtained by the bootstrap method.
Current usage metrics show cumulative count of Article Views (full-text article views including HTML views, PDF and ePub downloads, according to the available data) and Abstracts Views on Vision4Press platform.
Data correspond to usage on the plateform after 2015. The current usage metrics is available 48-96 hours after online publication and is updated daily on week days.
Initial download of the metrics may take a while.