Fig. B.2.
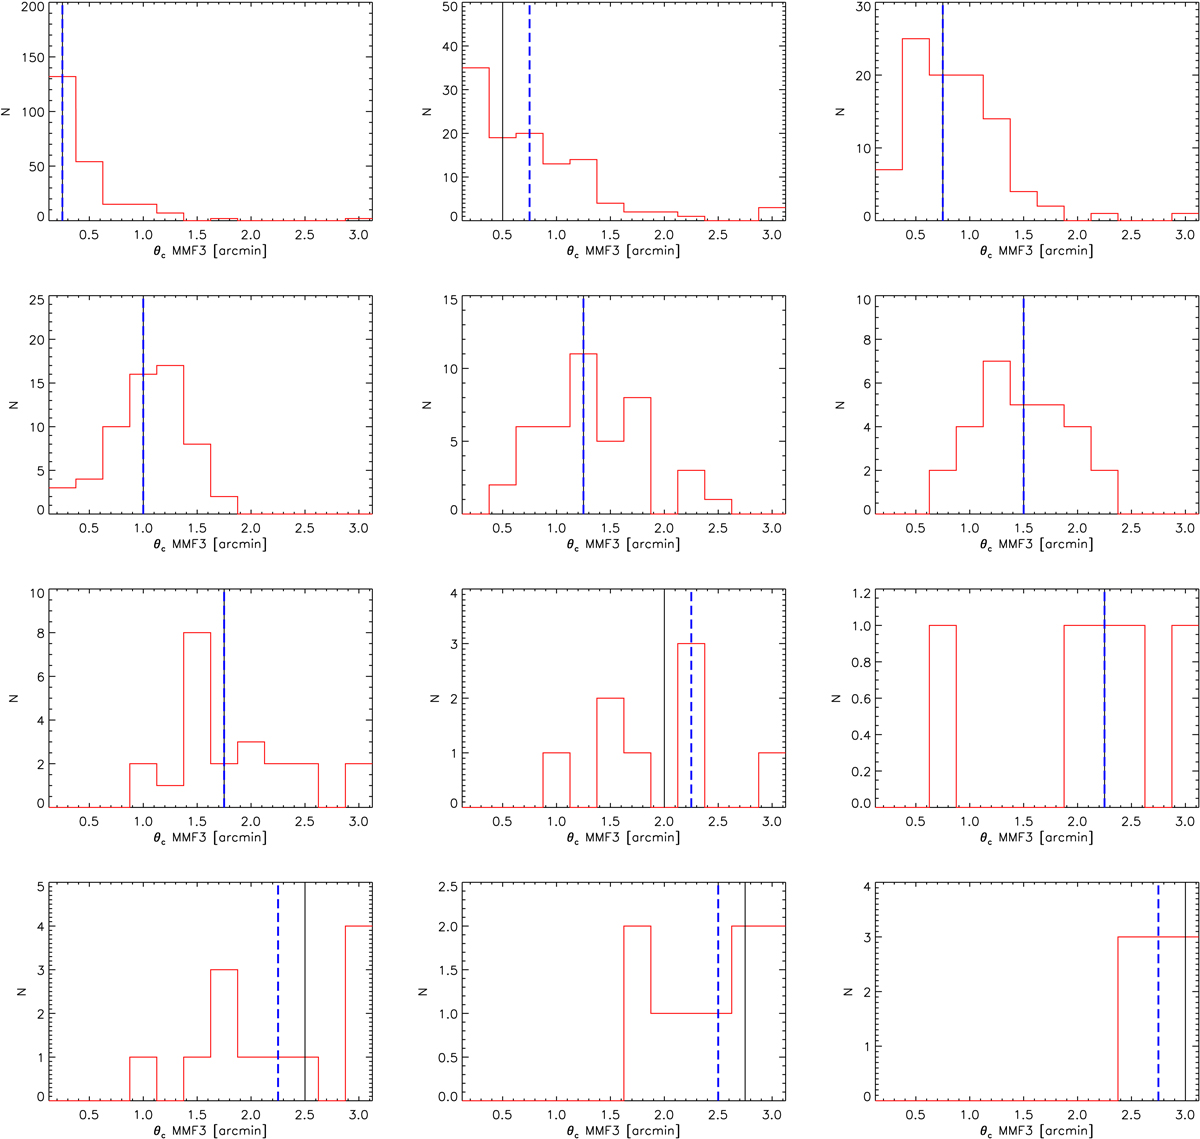
Histograms of cluster size as recovered by our algorithm. Each histogram corresponds to clusters with the same size θc determined by the SPT collaboration. The vertical black line displays the size from the SPT collaboration increasing from 0.25 to 3 arcmin in steps of 0.25 arcmin, from left to right and from top to bottom. The red histogram shows the distribution of the size recovered by our algorithm and the thick dashed vertical blue line is the median value of our recovered values. Our recovered sizes are in good agreement with the sizes published by the SPT collaboration.
Current usage metrics show cumulative count of Article Views (full-text article views including HTML views, PDF and ePub downloads, according to the available data) and Abstracts Views on Vision4Press platform.
Data correspond to usage on the plateform after 2015. The current usage metrics is available 48-96 hours after online publication and is updated daily on week days.
Initial download of the metrics may take a while.