Fig. A.2.
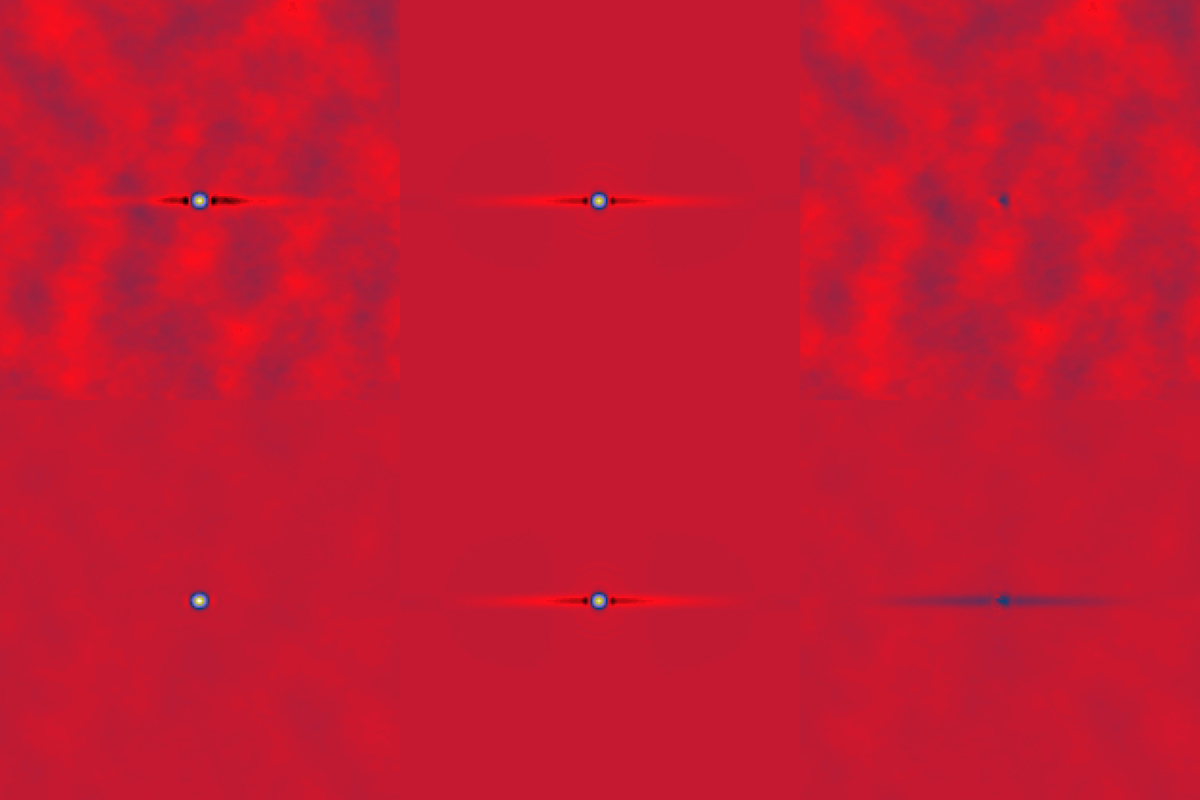
Stacks of the 150 GHz point sources of Mocanu et al. (2013) from the public SPT-SZ data in equatorial coordinates (a horizontal line lies at constant declination). The six square panels are 1.5 deg on a side. Top left: stack of point sources with published SPT flux below 50 mJy, normalized to the total flux of the stack computed from SPT published values. Top middle: Gaussian beam (FWHM = 1.75 arcmin) convolved with the filter transfer function. Top right: difference between top left and top middle images. The residuals are small. Bottom left: stack of point sources with published SPT flux above 50 mJy, normalized to the total flux of the stack computed from published SPT values. Bottom middle: identical to top middle, i.e., Gaussian beam (FWHM = 1.75 arcmin) convolved with the filter transfer function. Bottom right: difference between bottom left and bottom middle images. The residuals are significant. In particular, the stack does not show the negative tails before and after the central maximum in right ascension, which can be seen in black in the middle image. This difference in the patterns can be seen in the difference image as the horizontal trail.
Current usage metrics show cumulative count of Article Views (full-text article views including HTML views, PDF and ePub downloads, according to the available data) and Abstracts Views on Vision4Press platform.
Data correspond to usage on the plateform after 2015. The current usage metrics is available 48-96 hours after online publication and is updated daily on week days.
Initial download of the metrics may take a while.