Fig. A.1.
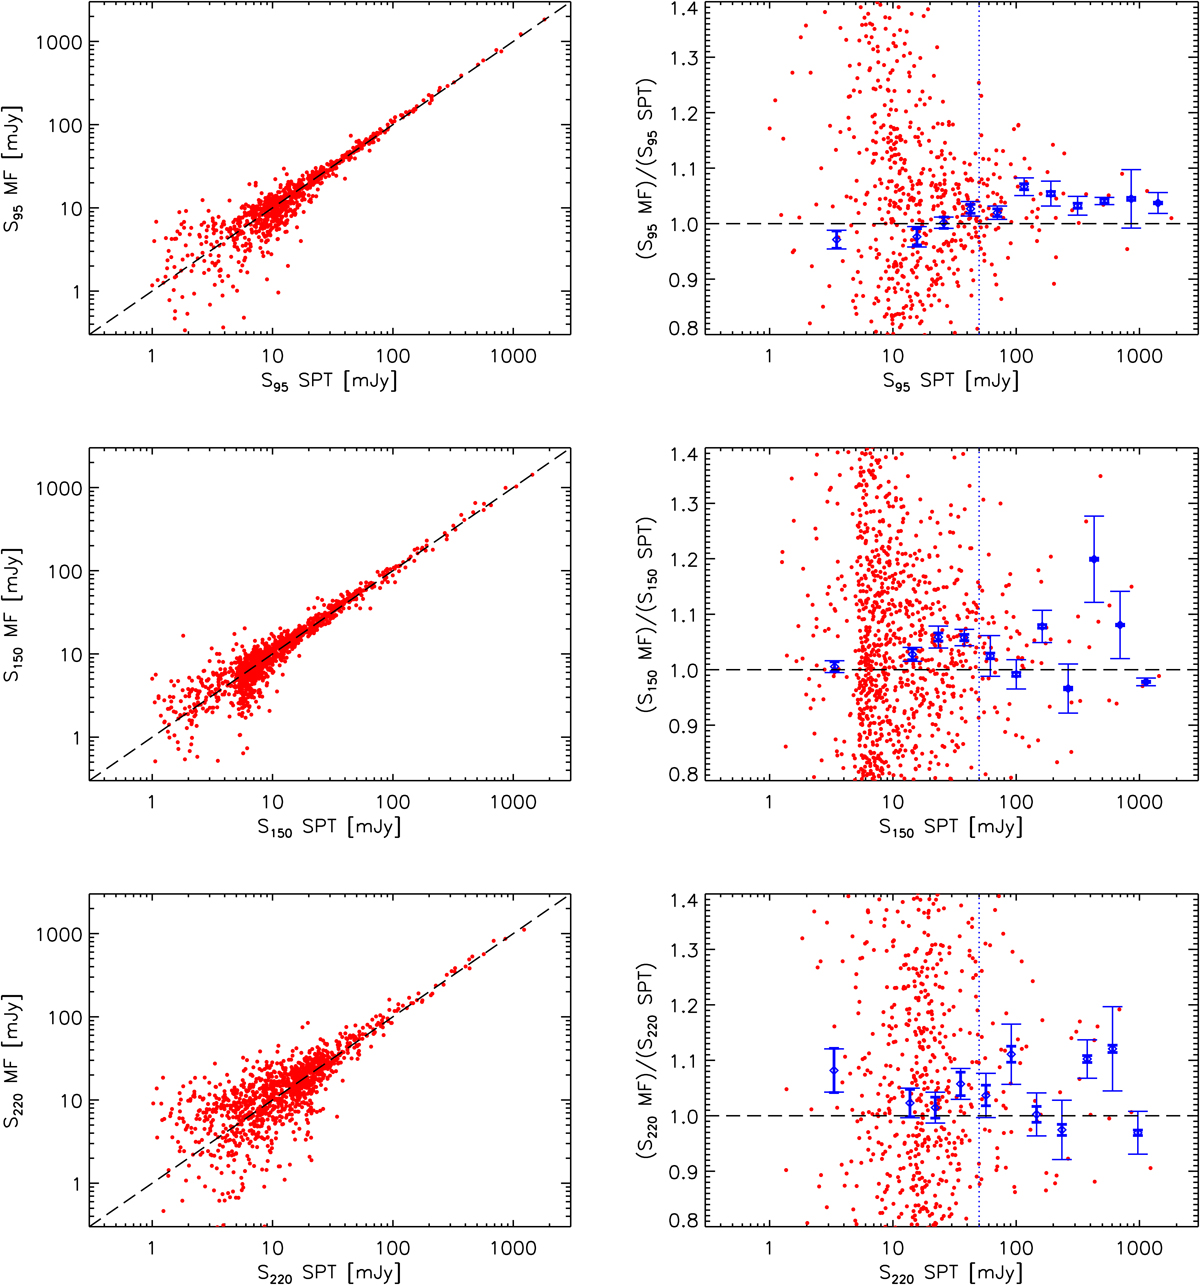
Left column: our single frequency matched filter flux versus published SPT flux for the point sources published in Mocanu et al. (2013) from 95 GHz (top) to 220 GHz (bottom). Red dots are individual point sources. There is overall agreement between our recovered fluxes and the values published by the SPT collaboration. Right column: zoom-in on the ratio between the two flux measurements as a function of the SPT flux. Blue diamonds are weighted averages. Thick bars display 68% statistical errors, and thin bars show 68% errors obtained by the bootstrap method. Despite the global agreement in the log-log plane shown in the left column, the ratio is significantly greater than unity, in particular at a large flux (S > 50 mJy) for the three SPT frequencies. We indicate this 50 mJy limit by the vertical blue dotted lines in the three panels.
Current usage metrics show cumulative count of Article Views (full-text article views including HTML views, PDF and ePub downloads, according to the available data) and Abstracts Views on Vision4Press platform.
Data correspond to usage on the plateform after 2015. The current usage metrics is available 48-96 hours after online publication and is updated daily on week days.
Initial download of the metrics may take a while.