Fig. 12.
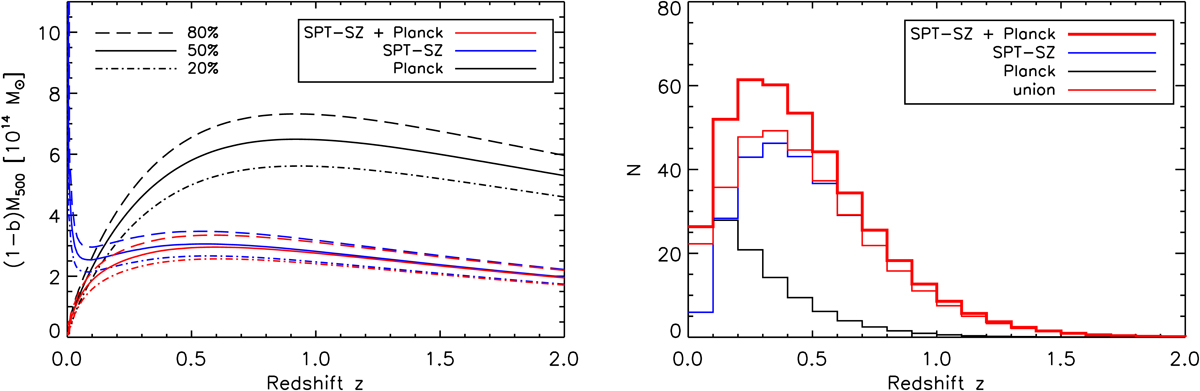
Left: completeness of the joint Planck+SPT-SZ survey (red) compared to the completeness of individual Planck (black) and SPT-SZ (blue) surveys. The dashed, solid, and dotted-dashed line correspond to the 80, 50, and 20% completeness level, respectively. Right: predicted cluster counts in each redshift bin for a Planck Collaboration VI (2020) primary CMB cosmology in the SPT-SZ footprint. The Planck+SPT-SZ curve corresponds to the joint extraction, while the union curve corresponds to the union of the individual Planck and SPT-SZ catalogs. The mass bias factor (1 − b) was set to 0.63 in the right figure.
Current usage metrics show cumulative count of Article Views (full-text article views including HTML views, PDF and ePub downloads, according to the available data) and Abstracts Views on Vision4Press platform.
Data correspond to usage on the plateform after 2015. The current usage metrics is available 48-96 hours after online publication and is updated daily on week days.
Initial download of the metrics may take a while.