Fig. 11.
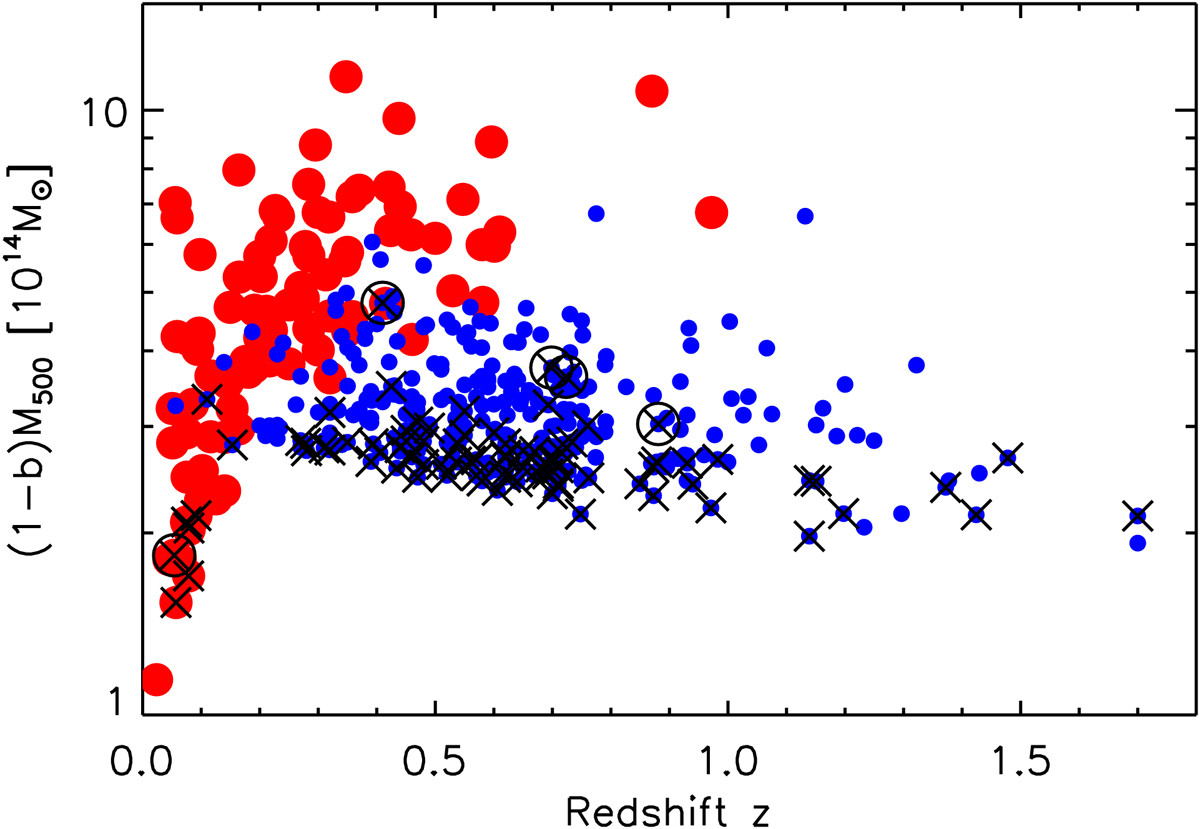
Mass-resdhift distribution of the SPT (small blue dots) and PSZ2 (large red dots) clusters. The SPT and Planck clusters that went undetected in the PSZSPT are marked with large black crosses. The large black circles additionally indicate the signal-to-noise greater than seven clusters missed by the PSZSPT. We note that (1 − b) is the mass bias factor as in Figs. 5 and 8.
Current usage metrics show cumulative count of Article Views (full-text article views including HTML views, PDF and ePub downloads, according to the available data) and Abstracts Views on Vision4Press platform.
Data correspond to usage on the plateform after 2015. The current usage metrics is available 48-96 hours after online publication and is updated daily on week days.
Initial download of the metrics may take a while.