Fig. 1.
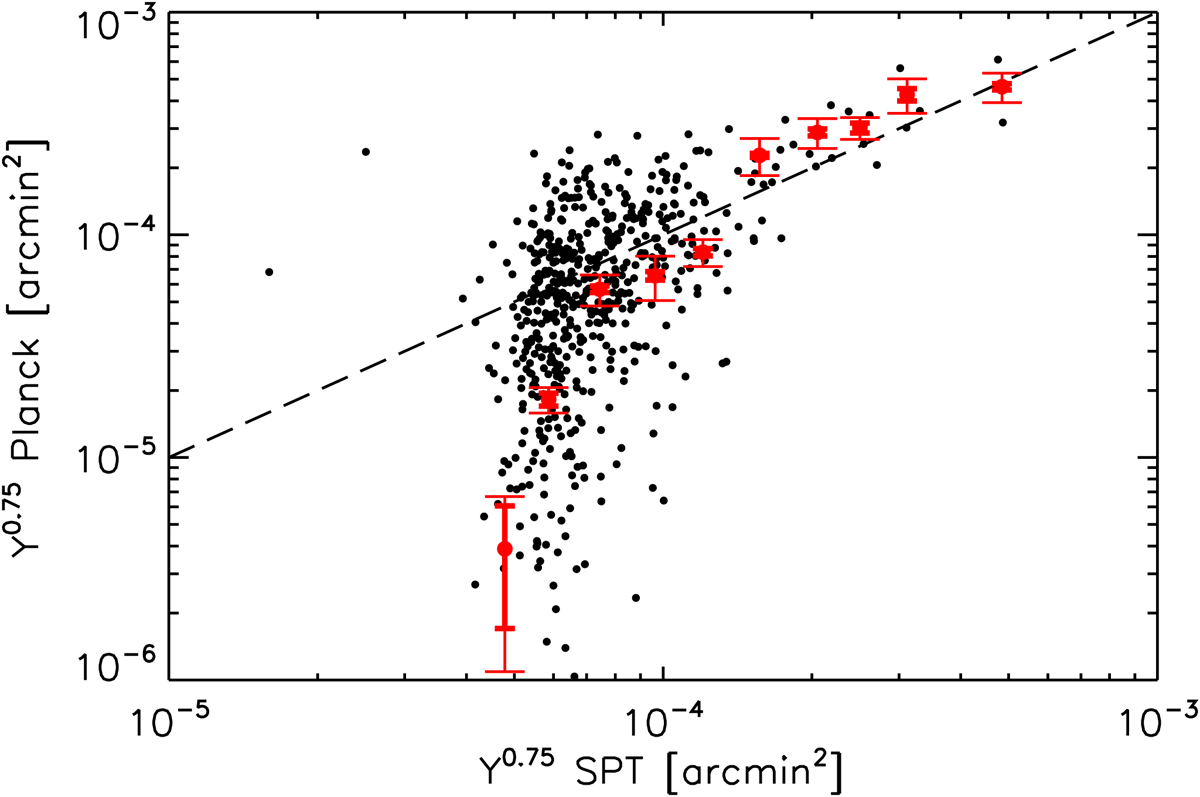
Planck flux of the SPT-SZ clusters (Bleem et al. 2015a) as a function of the published SPT-SZ flux. The black dots are individual clusters. The red diamonds are weighted averages. The thick error bars show statistical errors and the thin error bars were obtained by the bootstrap method. Despite a large scatter, the agreement between the SPT-SZ flux and the Planck flux is good. The drop-off at low flux is the Malmquist bias of the SPT-SZ flux due to the SPT detection threshold.
Current usage metrics show cumulative count of Article Views (full-text article views including HTML views, PDF and ePub downloads, according to the available data) and Abstracts Views on Vision4Press platform.
Data correspond to usage on the plateform after 2015. The current usage metrics is available 48-96 hours after online publication and is updated daily on week days.
Initial download of the metrics may take a while.