Fig. 5.
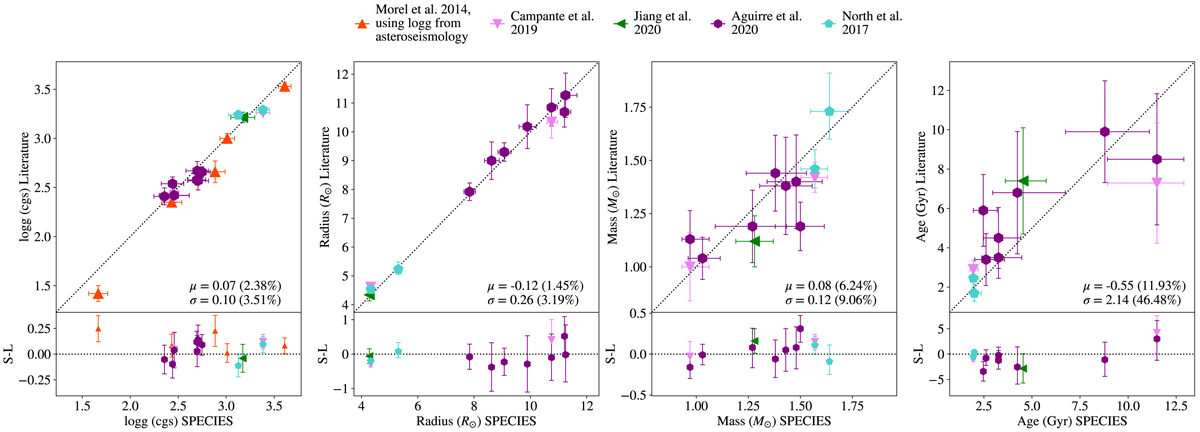
Top panels: comparison between SPECIES and the asteroseismology studies for the stars in our test sample. The black dotted line in each panel is the 1:1 relation. Bottom panels: difference SPECIES-literature, same as in Fig. 4. The quoted text are the mean and standard deviation of the residuals for each quantity, and their percentage from the mean values. Surface gravity values were not given in Aguirre et al. (2020) and North et al. (2017), but were computed from their masses and radius.
Current usage metrics show cumulative count of Article Views (full-text article views including HTML views, PDF and ePub downloads, according to the available data) and Abstracts Views on Vision4Press platform.
Data correspond to usage on the plateform after 2015. The current usage metrics is available 48-96 hours after online publication and is updated daily on week days.
Initial download of the metrics may take a while.