Fig. 4.
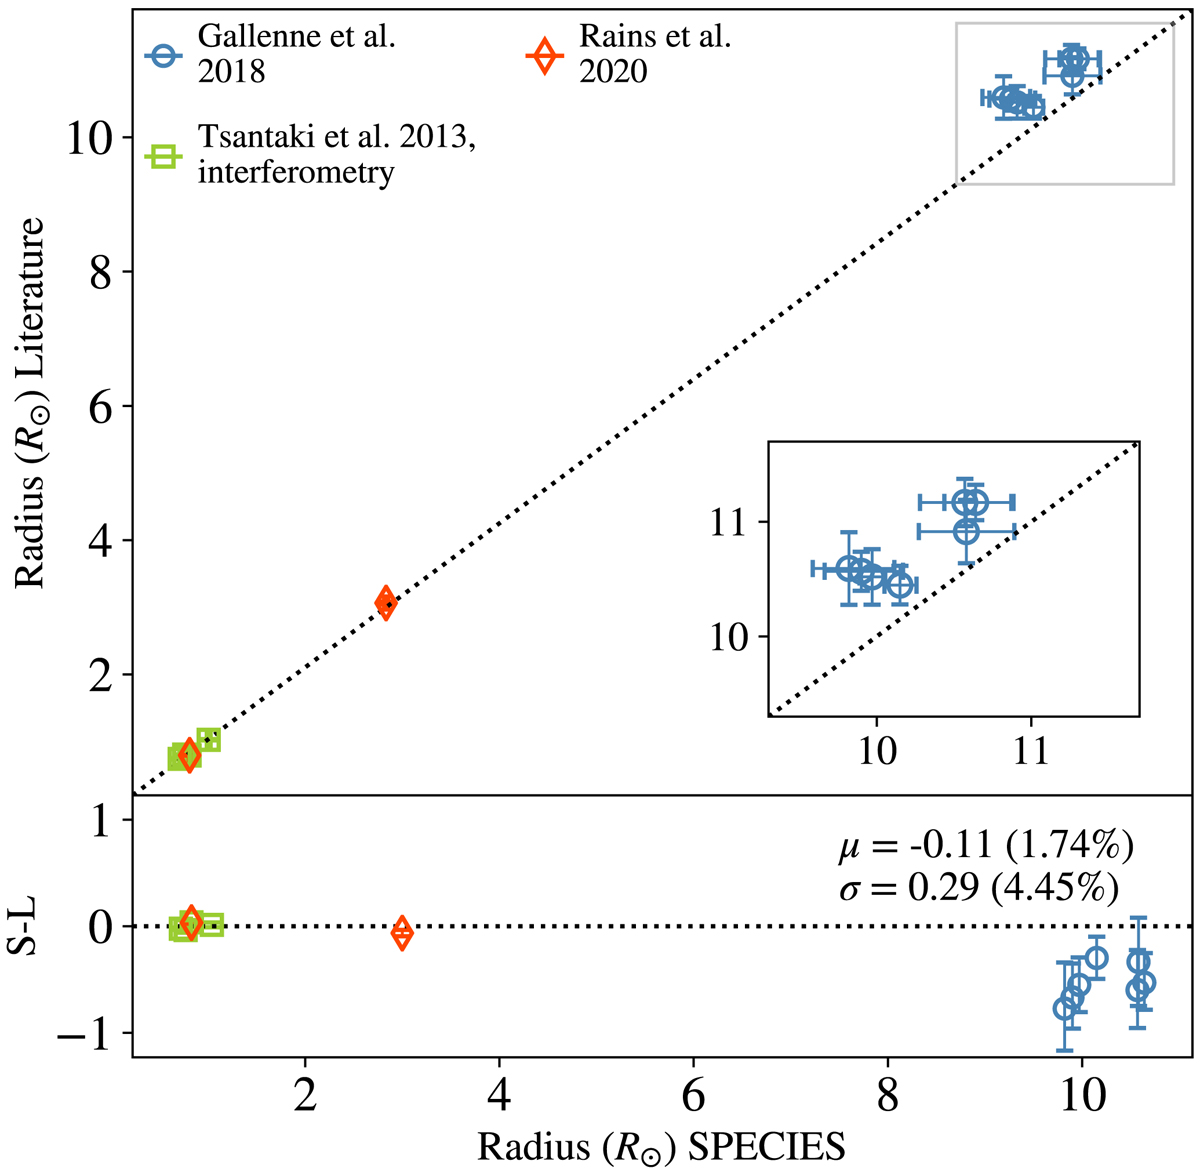
Top panel: comparison between the radius measurement from SPECIES and from works using interferometry for the stars in our test sample. The black dotted line is the 1:1 relation. The inset correspond to a zoom of the squared regions. Bottom panel: difference SPECIES-literature. Uncertainties are computed considering both SPECIES and literature values (![]() ). The quoted text is the mean and standard deviation of the residuals, and their percentage from the mean radius value.
). The quoted text is the mean and standard deviation of the residuals, and their percentage from the mean radius value.
Current usage metrics show cumulative count of Article Views (full-text article views including HTML views, PDF and ePub downloads, according to the available data) and Abstracts Views on Vision4Press platform.
Data correspond to usage on the plateform after 2015. The current usage metrics is available 48-96 hours after online publication and is updated daily on week days.
Initial download of the metrics may take a while.