Fig. 3.
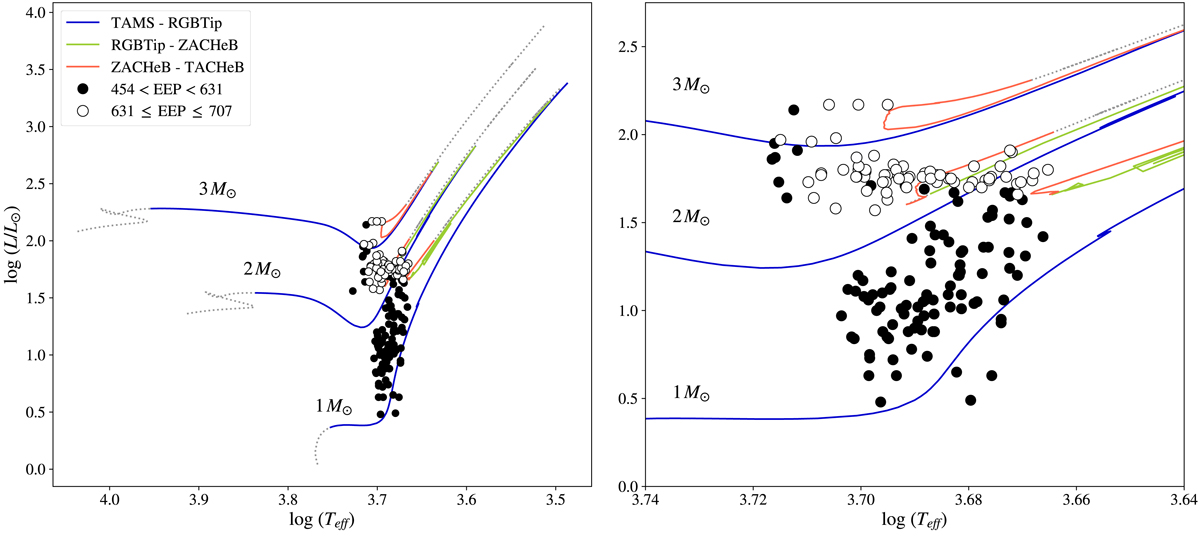
H-R diagram of the giant star sample. The right panel is a close-up of the area where the stars in the sample are located. Open circles represent RGB stars and filled circles are HB stars. The tracks plotted have [Fe/H] = 0.0 and the different colours represent different phases in the stellar evolution. Grey lines represent the stages before the main sequence evolution (up to the TAMS, Table 2), and right after the end of core helium burning (TACHeB). For the meaning of the abbreviations and EEP number, see Table 2.
Current usage metrics show cumulative count of Article Views (full-text article views including HTML views, PDF and ePub downloads, according to the available data) and Abstracts Views on Vision4Press platform.
Data correspond to usage on the plateform after 2015. The current usage metrics is available 48-96 hours after online publication and is updated daily on week days.
Initial download of the metrics may take a while.