Fig. 2.
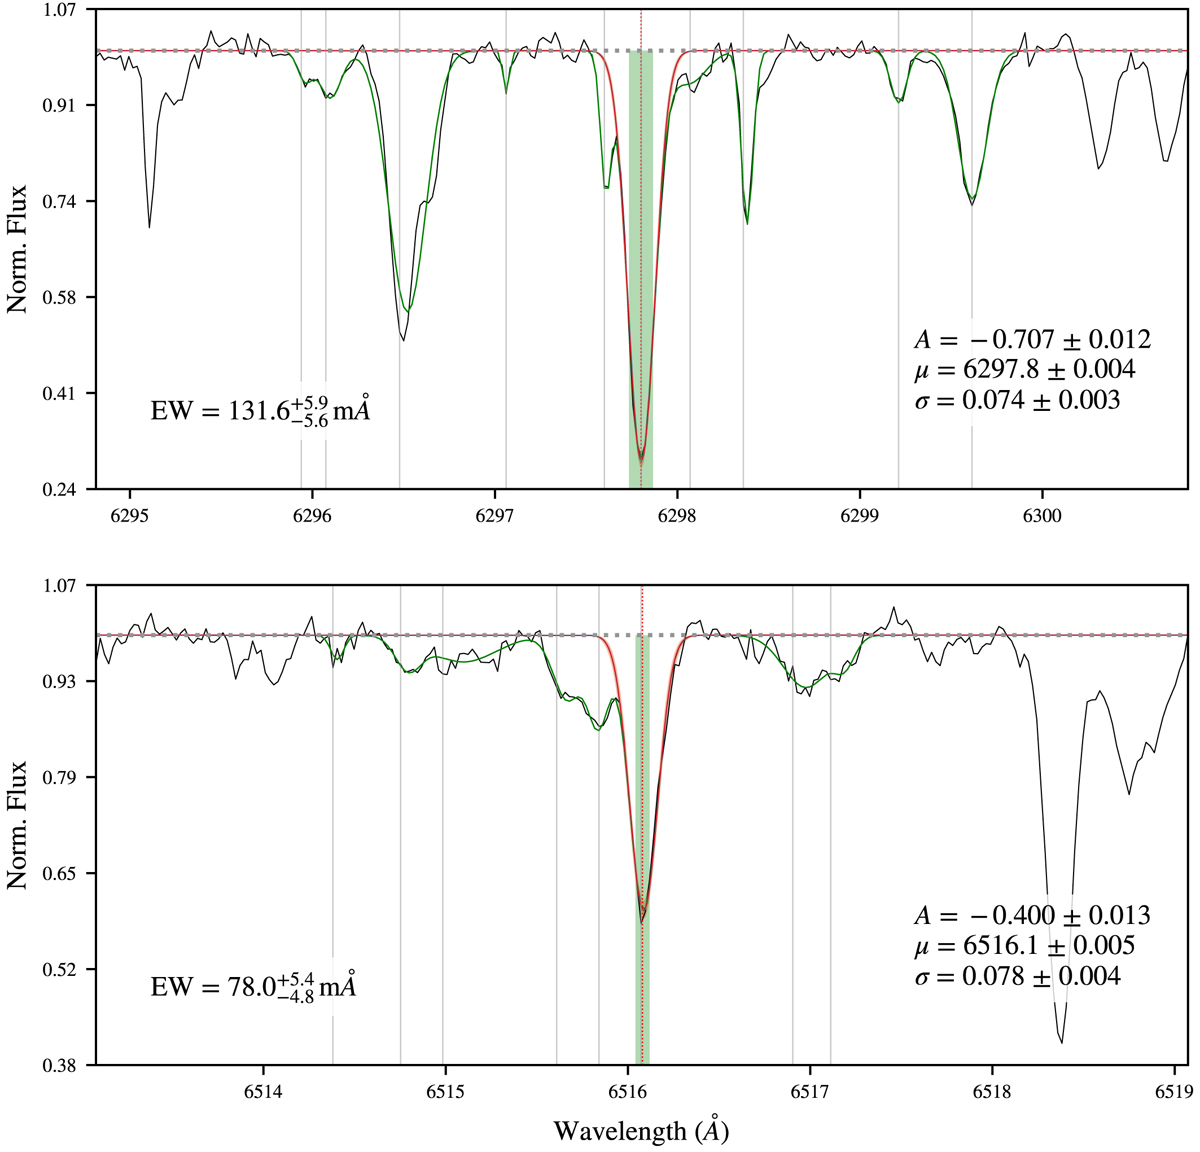
Fit performed using the EWComputation module to the blended lines Fe I 6297.80 Å and Fe II 6516.08 Å, from the giant star HIP9313 taken with CHIRON. The right-most text contains the values of A, μ, and σ, the amplitude, mean, and standard deviation, respectively, of the best Gaussian fit, along with their corresponding uncertainties eA, eμ, and eσ. The grey lines are the absorption lines detected in the spectral range, and the green line the global fit to the data. The red region corresponds to the fit of the line, l, with its uncertainty, derived using the Gaussian parameters plus their uncertainties. The green block represents the equivalent width, quoted in the left-most text. The full procedure is explained in Appendix A.
Current usage metrics show cumulative count of Article Views (full-text article views including HTML views, PDF and ePub downloads, according to the available data) and Abstracts Views on Vision4Press platform.
Data correspond to usage on the plateform after 2015. The current usage metrics is available 48-96 hours after online publication and is updated daily on week days.
Initial download of the metrics may take a while.