Fig. 11.
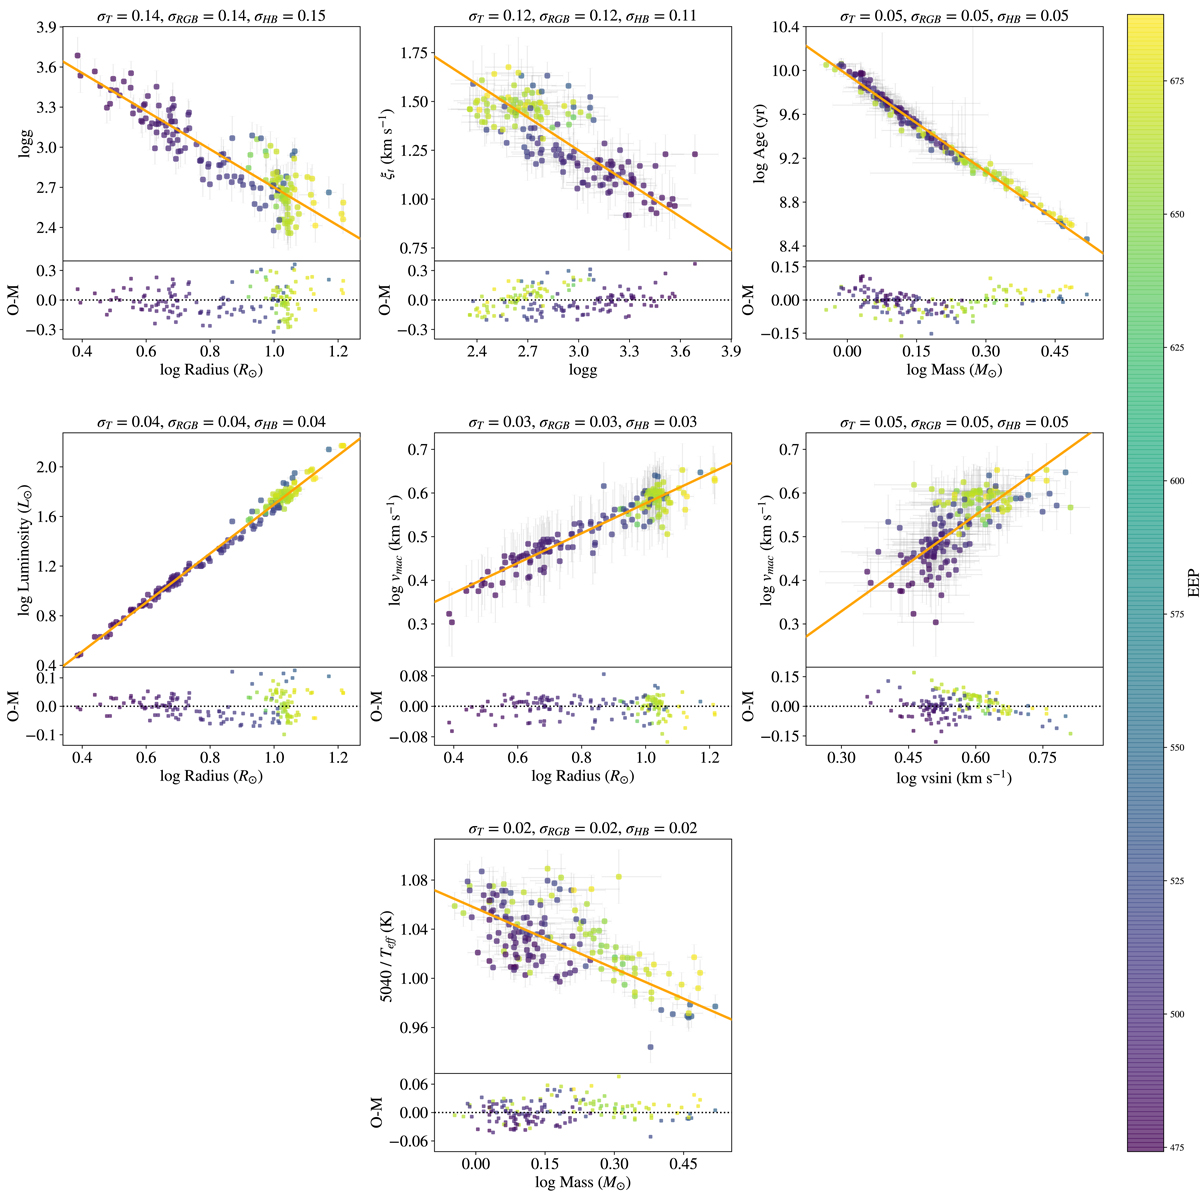
Correlations found between parameters derived in this work. The orange lines are the polynomial fits. Bottom panels are the residuals after subtracting the polynomial fits. The colour scale represents the median EEP for each target. Titles show the scatter in the residuals for the total sample (σT), stars in the RGB (σRGB) and in the HB (σHB).
Current usage metrics show cumulative count of Article Views (full-text article views including HTML views, PDF and ePub downloads, according to the available data) and Abstracts Views on Vision4Press platform.
Data correspond to usage on the plateform after 2015. The current usage metrics is available 48-96 hours after online publication and is updated daily on week days.
Initial download of the metrics may take a while.