Fig. 6.
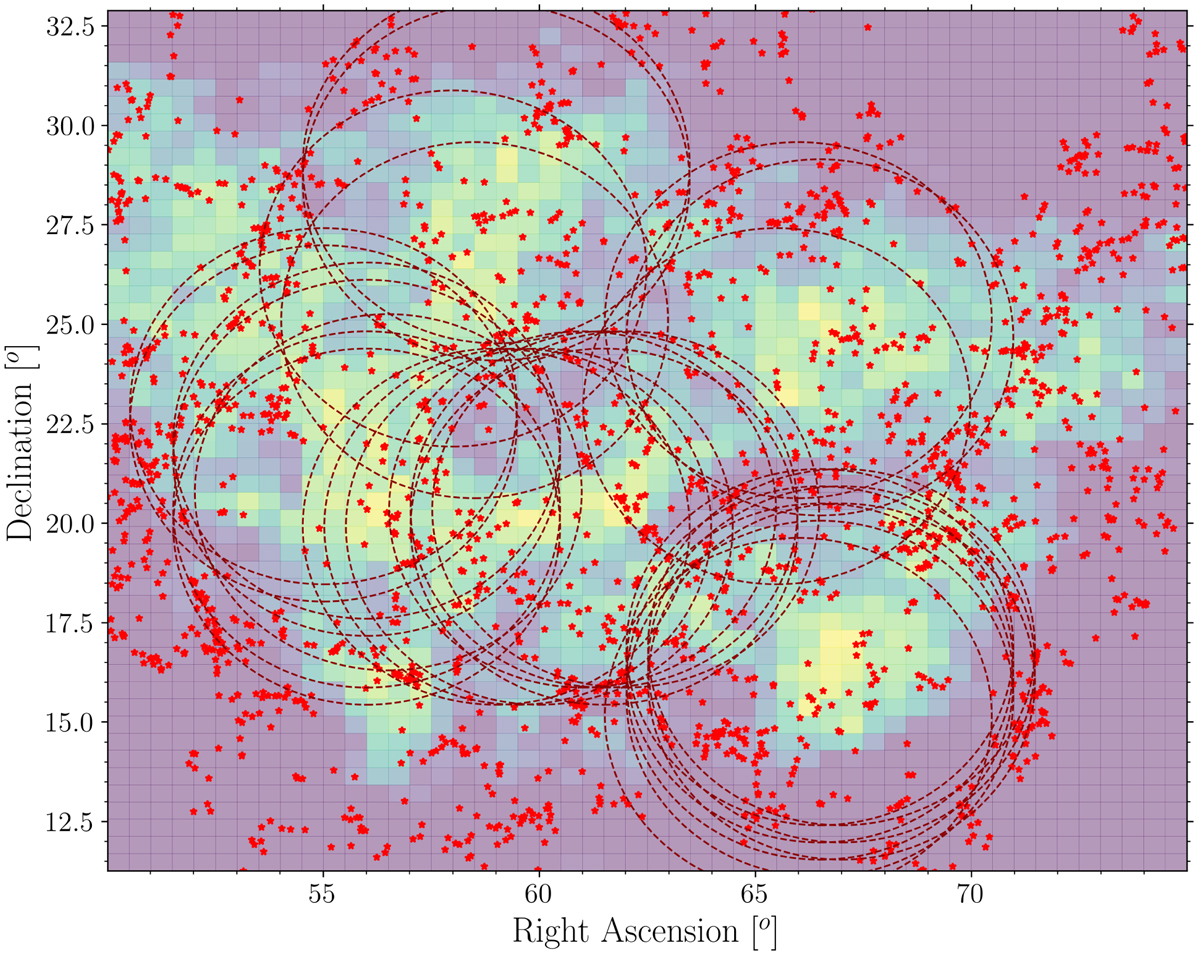
Angular distribution of the probable centers for the redshift range 0.51 < z < 0.52 (color scale), generated from the R0 = 109.9 h−1 Mpc kernel on a portion of the SDSS DR9 data. Galaxies locations are shown as red stars. The dashed circles reflect the angles subtended by the BAO spheres at z = 0.515. BAO circles are only shown around the most probable center locations.
Current usage metrics show cumulative count of Article Views (full-text article views including HTML views, PDF and ePub downloads, according to the available data) and Abstracts Views on Vision4Press platform.
Data correspond to usage on the plateform after 2015. The current usage metrics is available 48-96 hours after online publication and is updated daily on week days.
Initial download of the metrics may take a while.