Fig. 4.
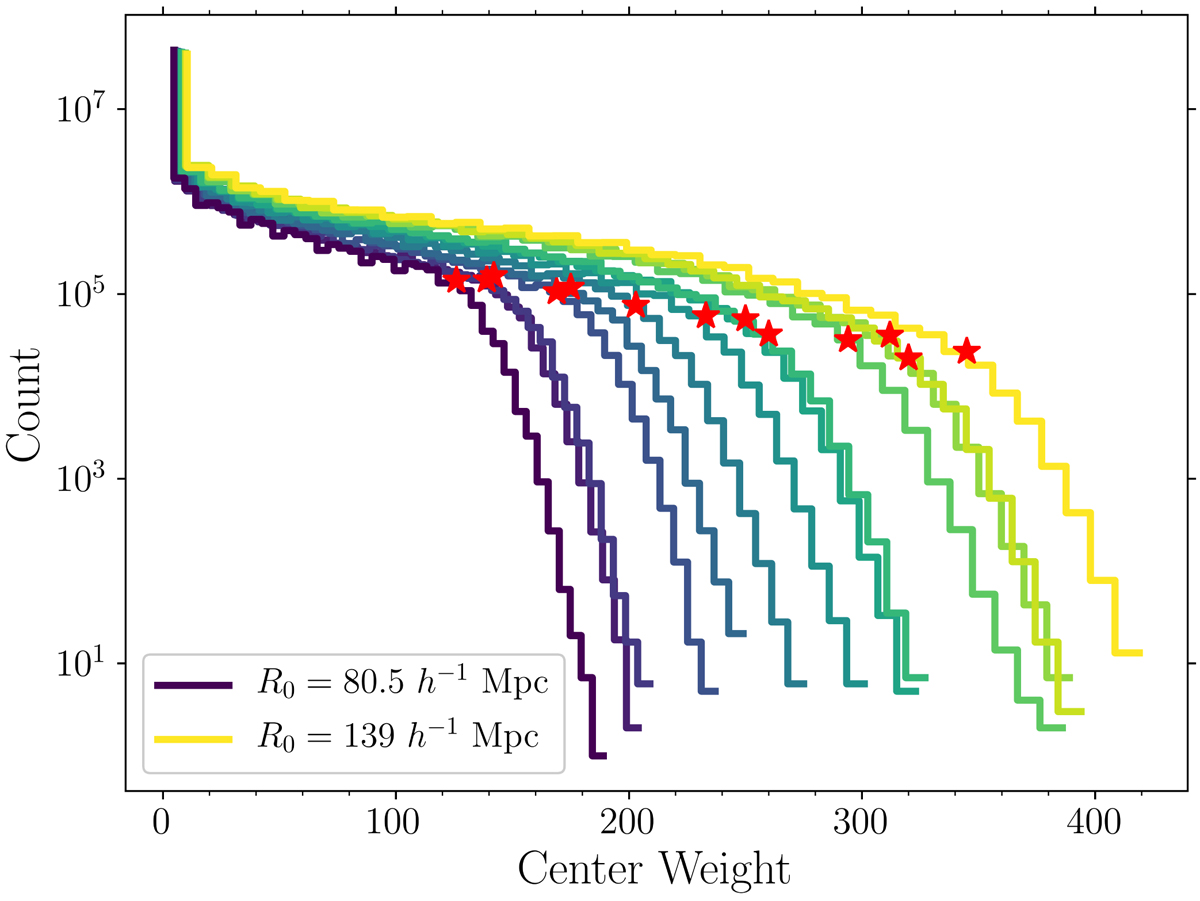
Distribution of center weights, for kernels of different sizes, applied to a random catalog with the same fiducial volume and density as the SDSS DR9 CMASS NGC survey. The dark blue curve corresponds to R0 = 80.5 h−1 Mpc and yellow corresponds to R0 = 139 h−1 Mpc. Intermediate colors correspond to the intermediate kernel sizes used in this analysis. The red stars indicate the threshold values, Cmin used to create catalogs of probable centers at each kernel size.
Current usage metrics show cumulative count of Article Views (full-text article views including HTML views, PDF and ePub downloads, according to the available data) and Abstracts Views on Vision4Press platform.
Data correspond to usage on the plateform after 2015. The current usage metrics is available 48-96 hours after online publication and is updated daily on week days.
Initial download of the metrics may take a while.