Fig. 3.
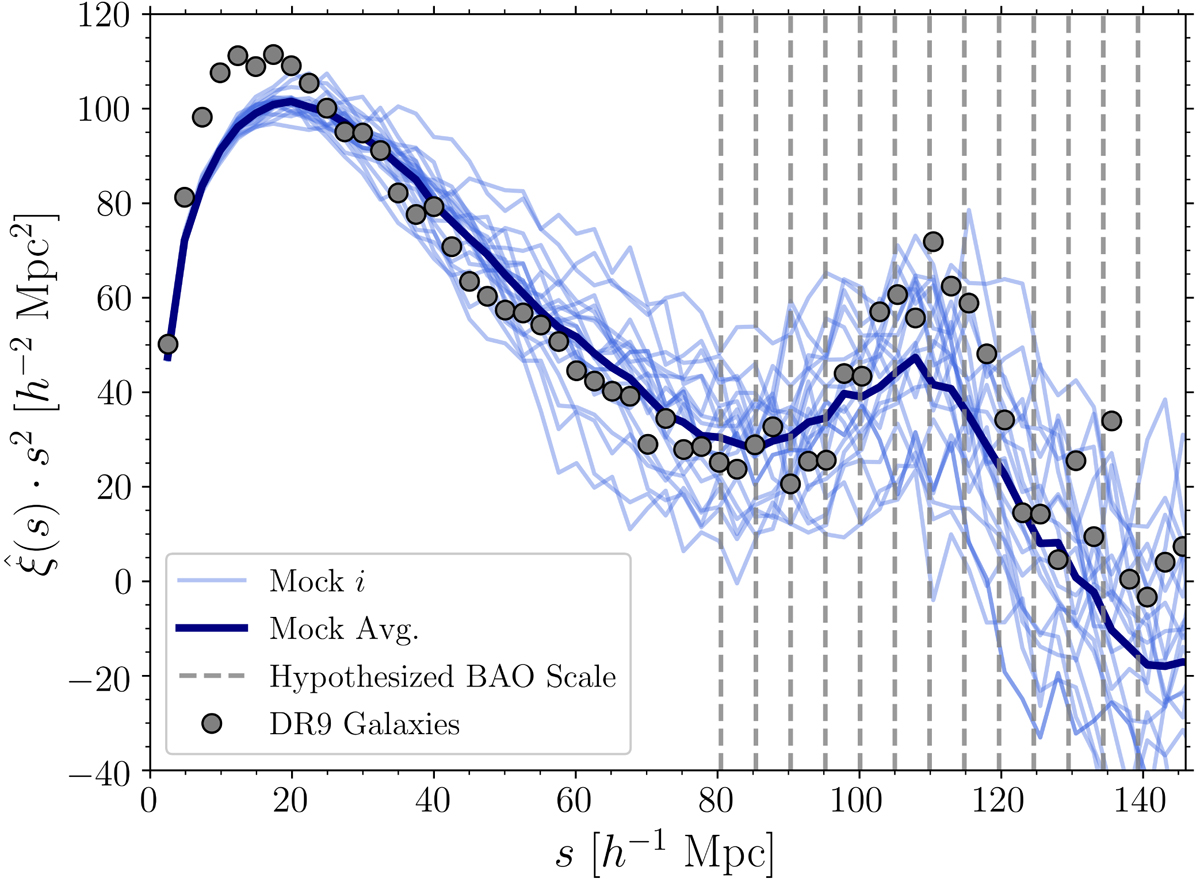
Two-point correlation function, ![]() , of SDSS DR9 galaxies (gray circles) and 20 mock catalogs (blue lines) described in Sect. 3.1, as a function of the comoving separation, s. The average of the mock ensemble is given by the solid navy line. Kernel sizes (hypothesized BAO scales) used by CenterFinder in this analysis are shown by vertical dashed gray lines.
, of SDSS DR9 galaxies (gray circles) and 20 mock catalogs (blue lines) described in Sect. 3.1, as a function of the comoving separation, s. The average of the mock ensemble is given by the solid navy line. Kernel sizes (hypothesized BAO scales) used by CenterFinder in this analysis are shown by vertical dashed gray lines.
Current usage metrics show cumulative count of Article Views (full-text article views including HTML views, PDF and ePub downloads, according to the available data) and Abstracts Views on Vision4Press platform.
Data correspond to usage on the plateform after 2015. The current usage metrics is available 48-96 hours after online publication and is updated daily on week days.
Initial download of the metrics may take a while.