Fig. 10.
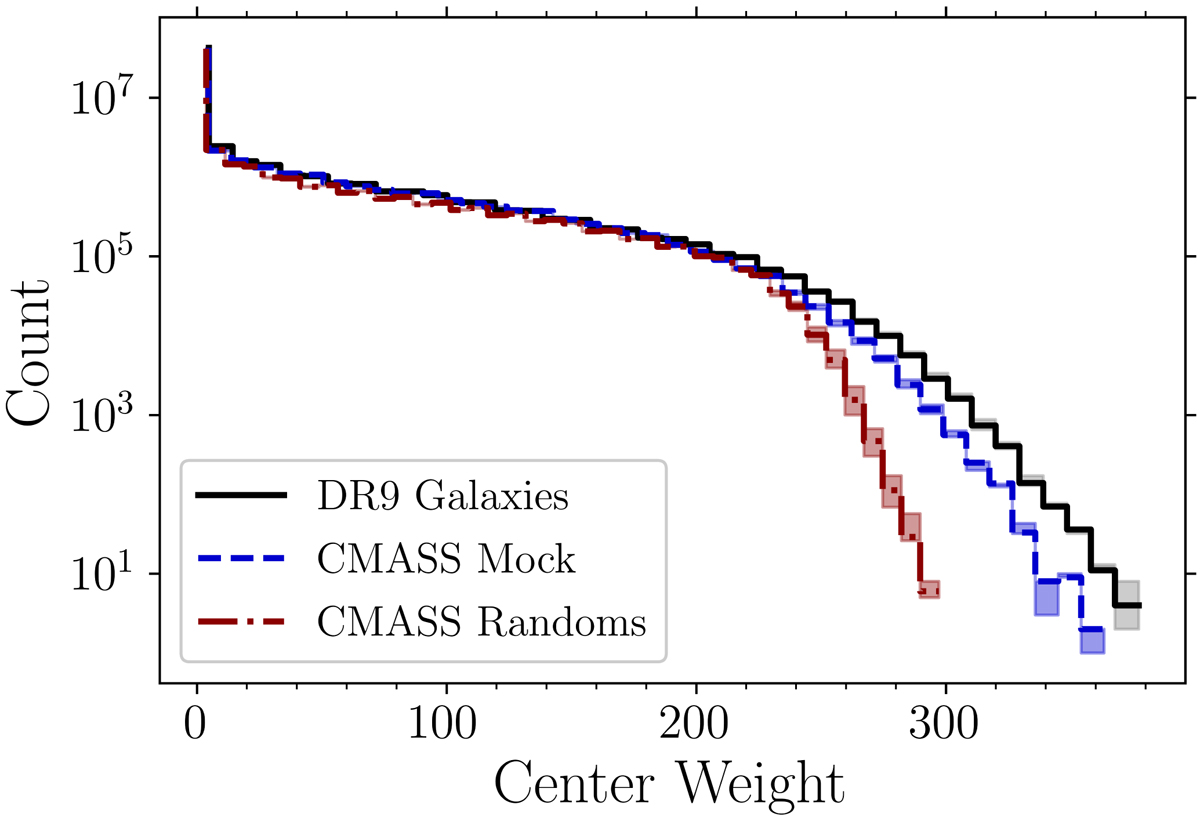
Distribution of center weights, for a kernel with a radius reflecting the approximate BAO scale, extracted from the 2pcf, R0 = 109.9 h−1 Mpc for SDSS DR9 galaxies (solid black line), one of the CMASS mocks (blue dashed line), and one of the CMASS randoms (dot-dashed red line). The shaded regions represent uncertainties across a range of values for ΩM, which is equal to the uncertainty in the most recent estimate from the Planck Collaboration.
Current usage metrics show cumulative count of Article Views (full-text article views including HTML views, PDF and ePub downloads, according to the available data) and Abstracts Views on Vision4Press platform.
Data correspond to usage on the plateform after 2015. The current usage metrics is available 48-96 hours after online publication and is updated daily on week days.
Initial download of the metrics may take a while.