Fig. 3.
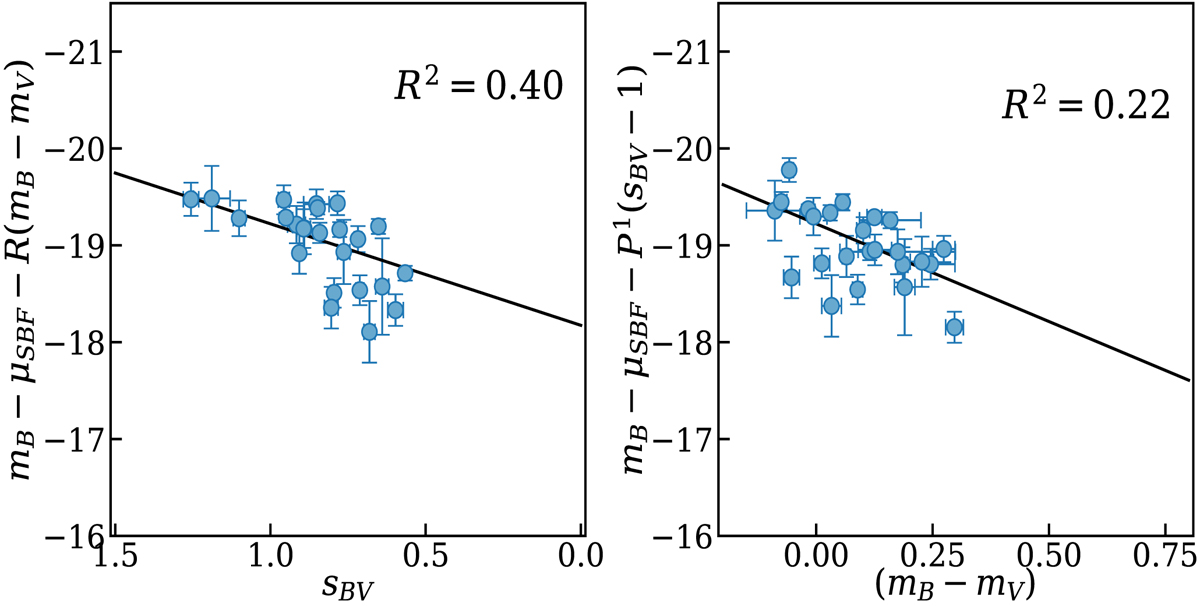
Luminosity correlation plots for the SBF sample: the absolute magnitude (mB − μSBF) corrected for the color vs. the LC stretch parameter (left panel), and the absolute magnitude corrected for the LC stretch vs. color (right panel). The correlation parameters are evaluated using the Bayesian analysis described in Sect. 3.4. The solid black lines show the best-fit model obtained with the MCMC sampling. The R2 score (coefficient of determination) of the fit is shown in the top right.
Current usage metrics show cumulative count of Article Views (full-text article views including HTML views, PDF and ePub downloads, according to the available data) and Abstracts Views on Vision4Press platform.
Data correspond to usage on the plateform after 2015. The current usage metrics is available 48-96 hours after online publication and is updated daily on week days.
Initial download of the metrics may take a while.