Fig. 1.
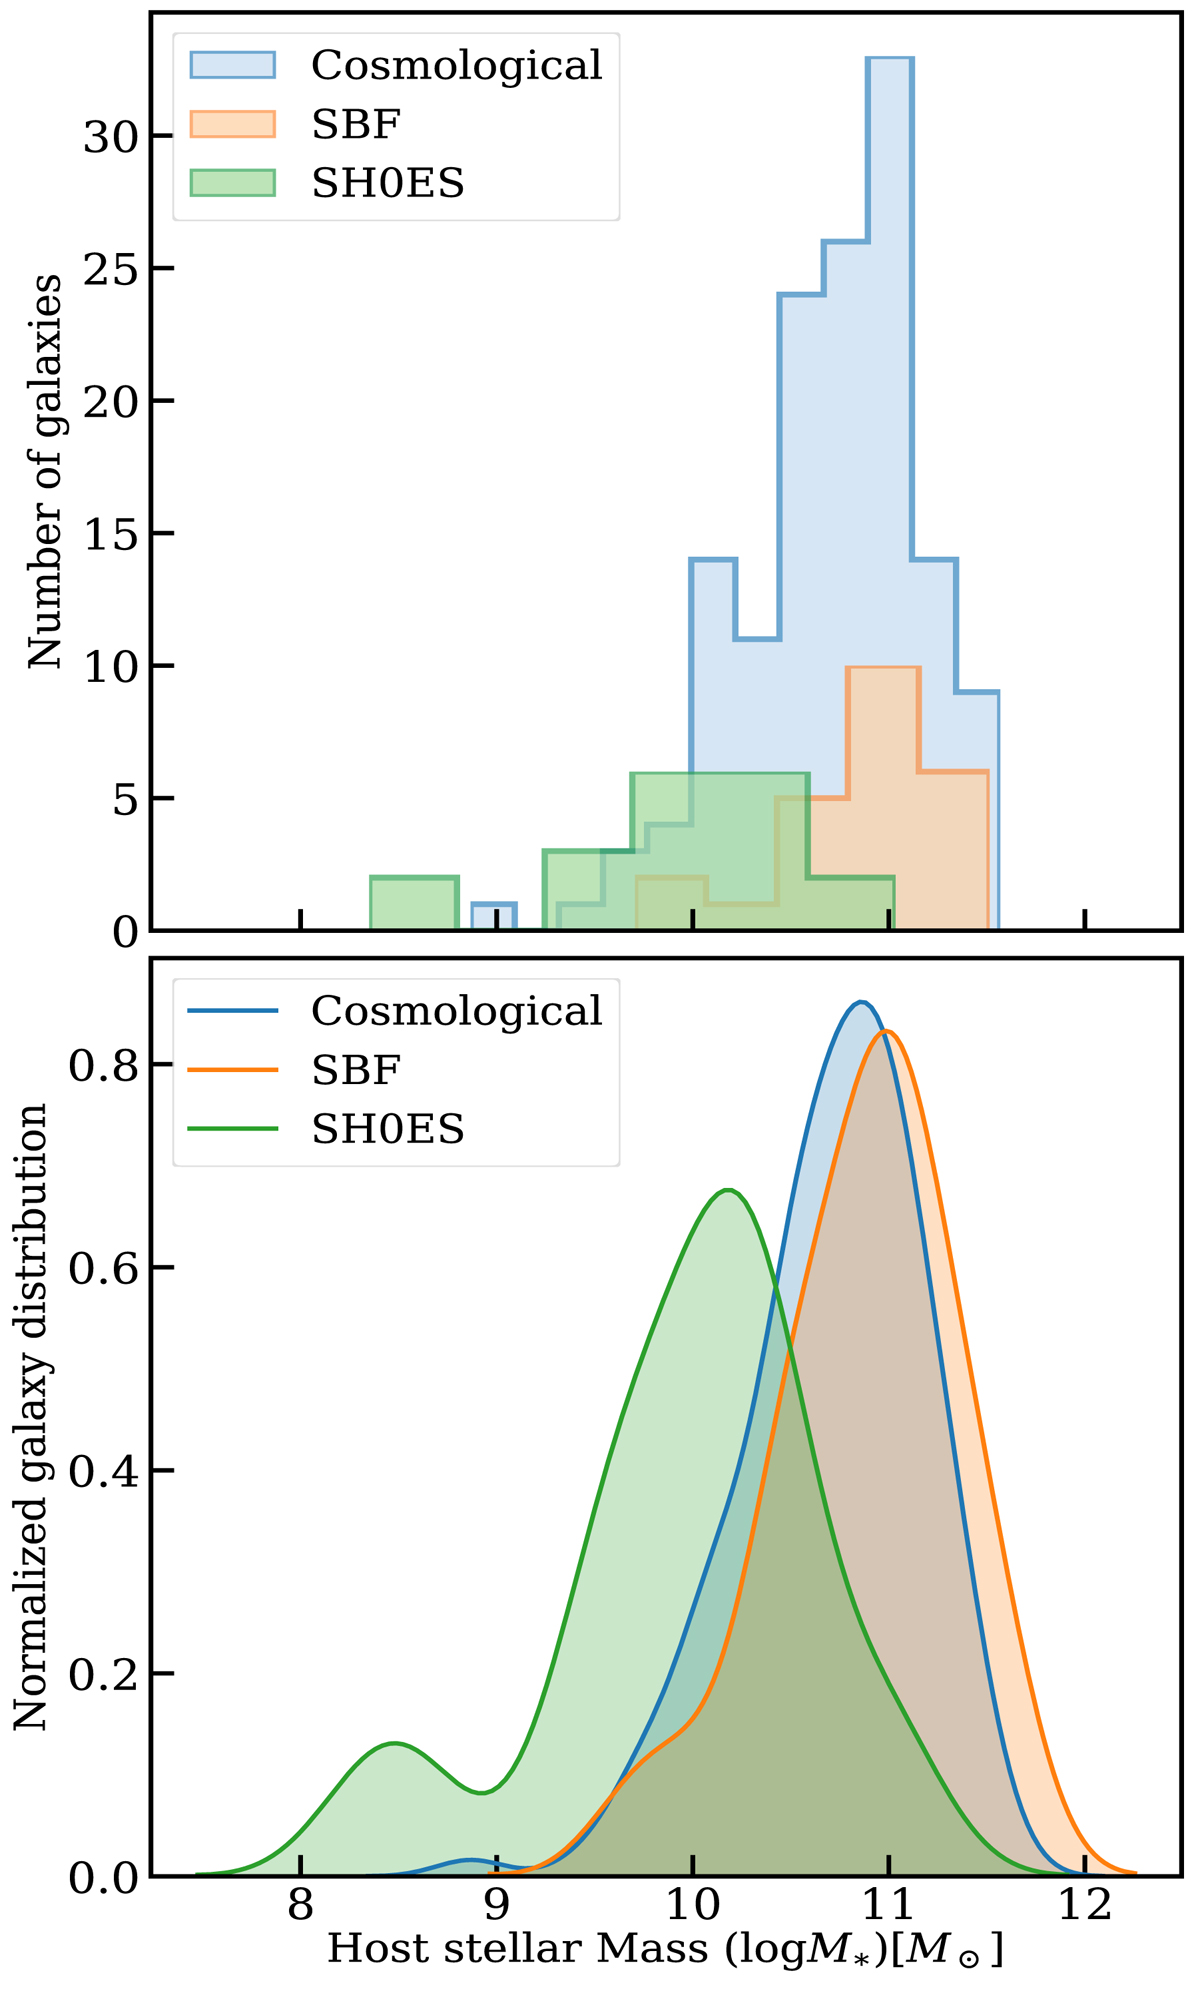
Number of galaxies (top panel) and the normalized density distribution (bottom panel) as a function of the host galaxy stellar mass for the SBF and the SH0ES calibration samples. We also plot the host stellar mass distribution for the cosmological sample. The KS-test P value for the two calibration samples gives 6.03 × 10⁻⁶, indicating that the stellar mass distributions of the host galaxies of SNe Ia are different for the two samples.
Current usage metrics show cumulative count of Article Views (full-text article views including HTML views, PDF and ePub downloads, according to the available data) and Abstracts Views on Vision4Press platform.
Data correspond to usage on the plateform after 2015. The current usage metrics is available 48-96 hours after online publication and is updated daily on week days.
Initial download of the metrics may take a while.