Fig. 4.
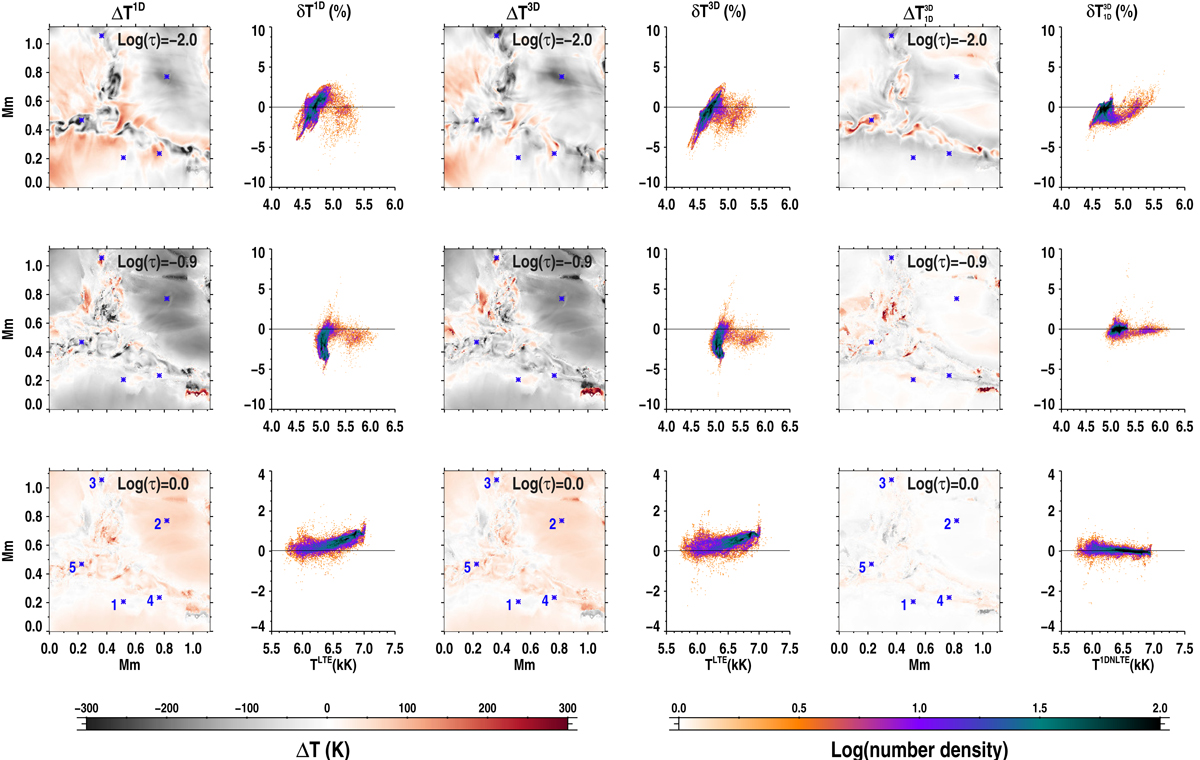
Difference in the temperature maps from the reference model and testmodel-1D (first column), and from the reference model and testmodel-3D (third column). The fifth column shows the difference between the temperatures in testmodel-1D and testmodel-3D. The scatter density plots next to each difference image are the corresponding relative differences, defined in Eqs. (1) and (2). See Sect. 3.1 for more details.
Current usage metrics show cumulative count of Article Views (full-text article views including HTML views, PDF and ePub downloads, according to the available data) and Abstracts Views on Vision4Press platform.
Data correspond to usage on the plateform after 2015. The current usage metrics is available 48-96 hours after online publication and is updated daily on week days.
Initial download of the metrics may take a while.