Fig. 2.
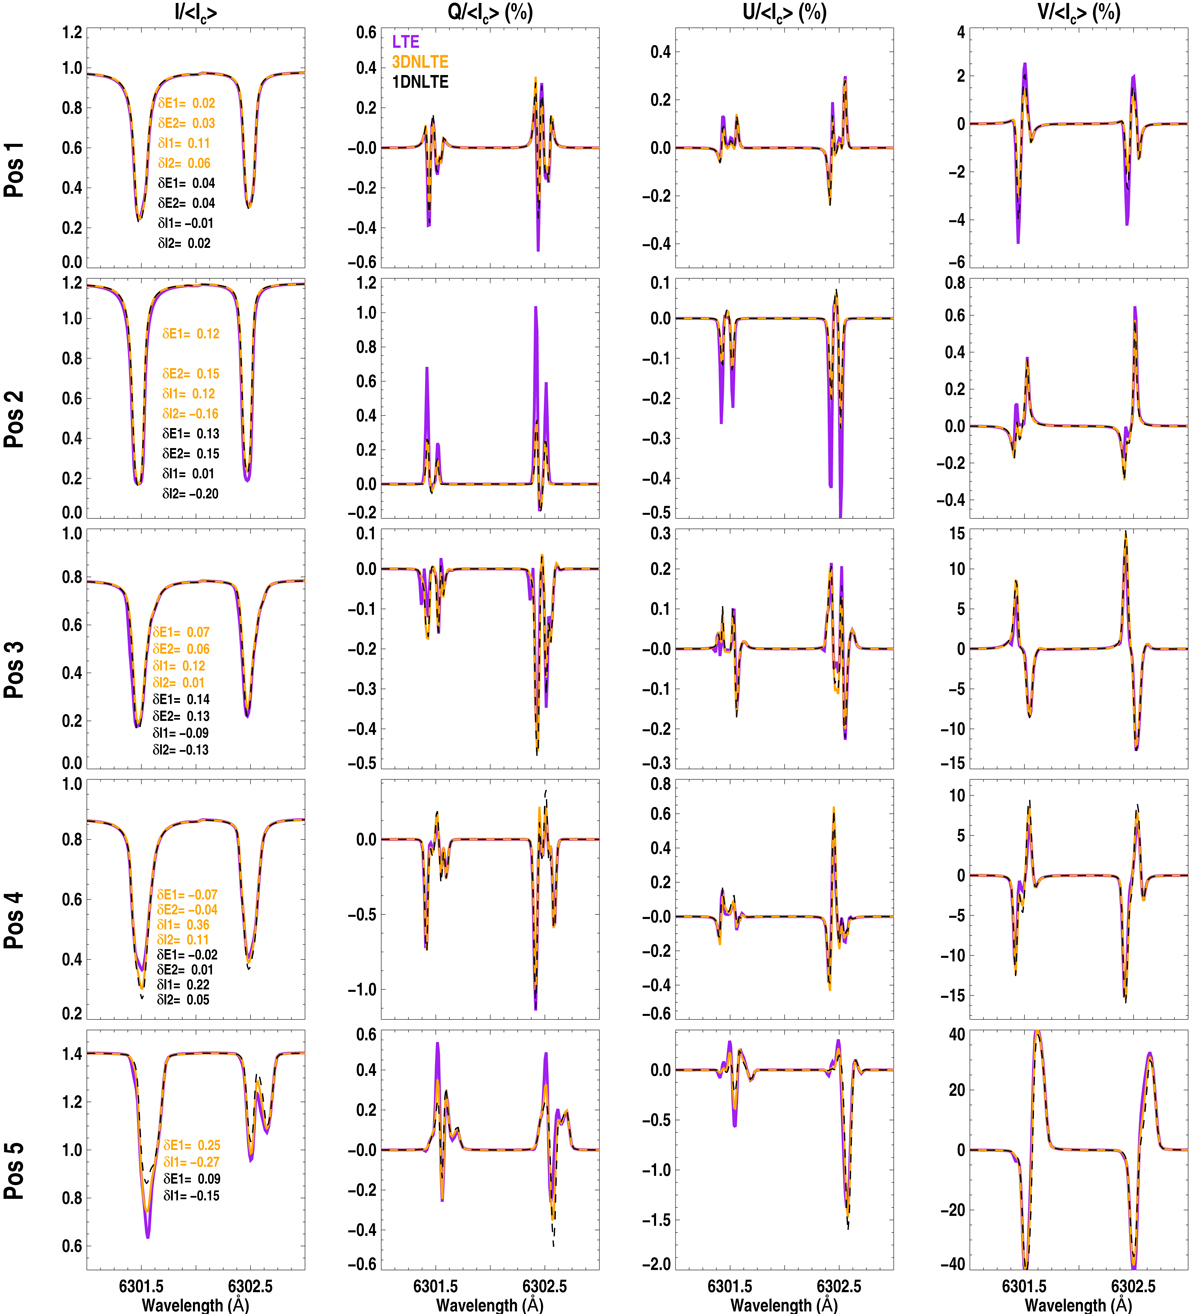
Stokes profiles at the five representative spatial points indicated in Fig. 1. The profiles computed in LTE, 1D NLTE, and 3D NLTE are indicated in purple, black, and orange, respectively. In the first column, the differences in equivalent widths and the residual intensities with respect to the LTE profiles are indicated for the two lines. They are computed using Eq. (3). For better visibility of the differences between the profiles, we again show the 1D NLTE and 3D NLTE profiles separately in Fig. 3.
Current usage metrics show cumulative count of Article Views (full-text article views including HTML views, PDF and ePub downloads, according to the available data) and Abstracts Views on Vision4Press platform.
Data correspond to usage on the plateform after 2015. The current usage metrics is available 48-96 hours after online publication and is updated daily on week days.
Initial download of the metrics may take a while.