Fig. 11.
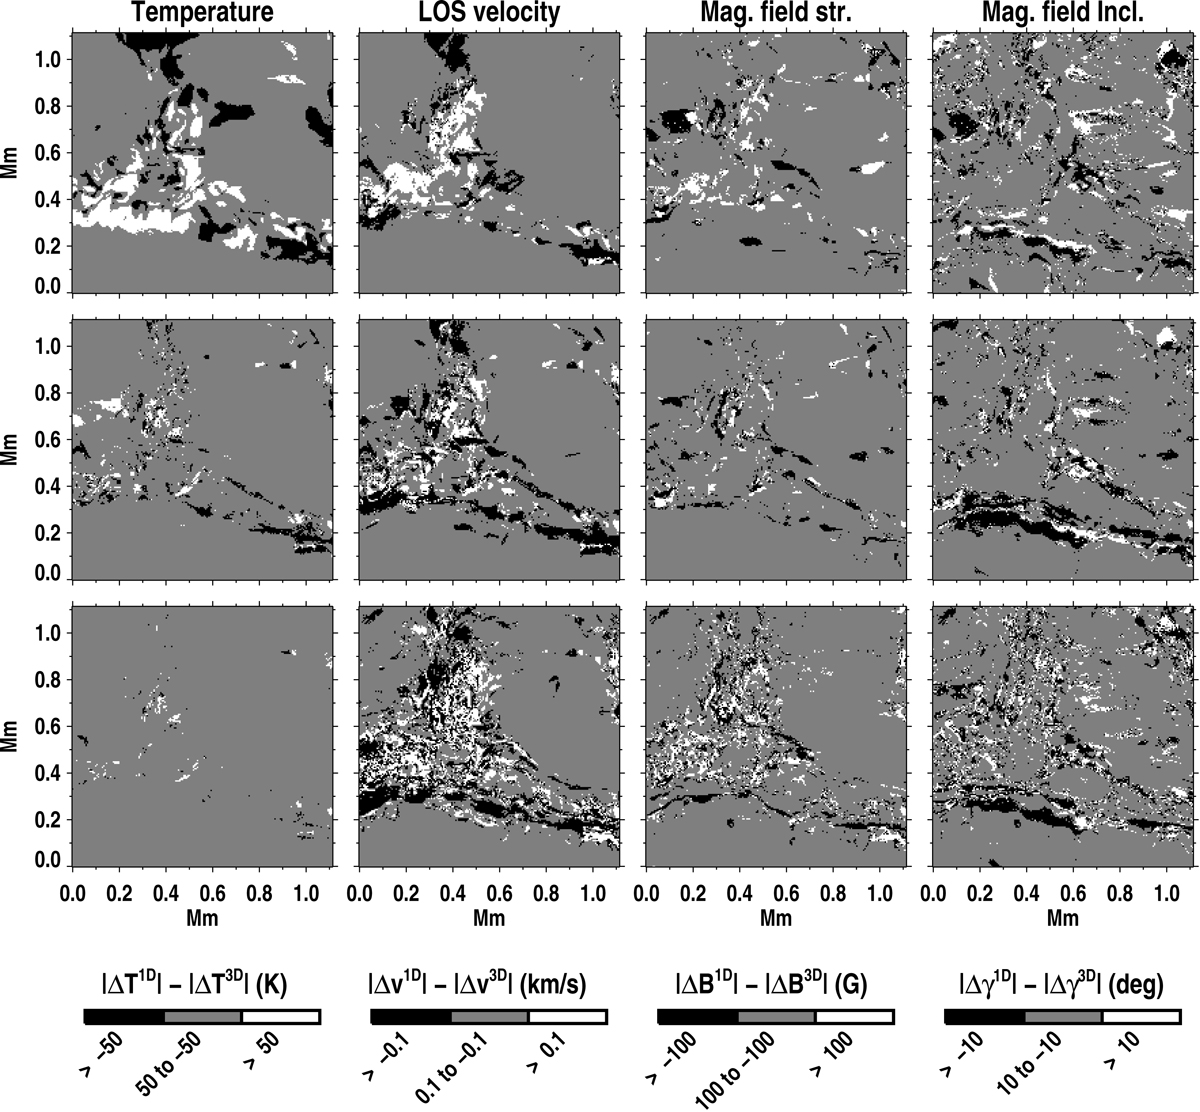
Patches representing the regions where horizontal RT enhances the NLTE effects (white), weaken the NLTE effects (black), or has no significant influence (grey). From left to right, we show this for T, vLOS, B, and γ at all the three inversion nodes; from top to bottom log(τ) = − 2.0, −0.9, and 0.0. The threshold values employed to divide the regions into the three categories are indicated in the colour bar. See Sect. 5 for further details.
Current usage metrics show cumulative count of Article Views (full-text article views including HTML views, PDF and ePub downloads, according to the available data) and Abstracts Views on Vision4Press platform.
Data correspond to usage on the plateform after 2015. The current usage metrics is available 48-96 hours after online publication and is updated daily on week days.
Initial download of the metrics may take a while.