Fig. 1.
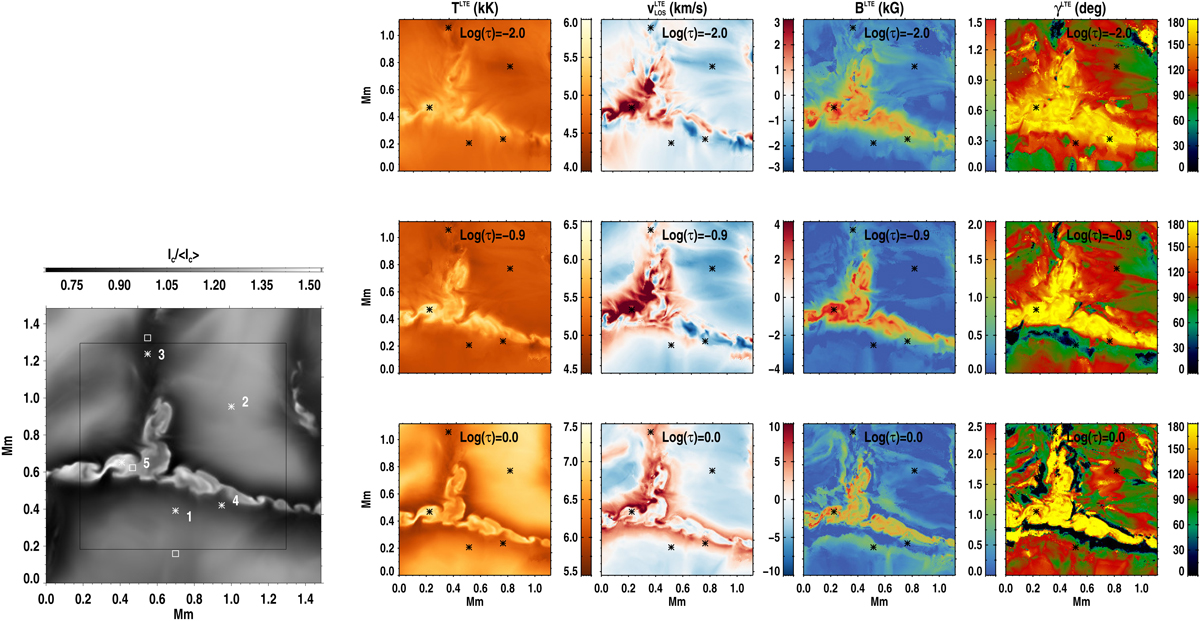
Left: continuum intensity image normalised with spatially averaged continuum intensity. It is a small patch of a larger cube used in Paper I. The inner black box indicates the actual area used for analysis in this paper. The area outside of this box has been neglected because of the minor uncertainties in the intensity profiles that can result from the non-periodic boundary conditions. The five representative spatial points are marked. For positions 1, 3, and 5, the locations used for them in Paper I are indicated by white squares. Right: maps of the temperature (T), LOS velocity (vLOS), and magnetic field strength (B), at log(τ) = − 2.0, −0.9, and 0.0, obtained from the inversion of LTE profiles. This is used as the “reference model”. In all the 2D maps in this paper, the origin is taken as (0, 0).
Current usage metrics show cumulative count of Article Views (full-text article views including HTML views, PDF and ePub downloads, according to the available data) and Abstracts Views on Vision4Press platform.
Data correspond to usage on the plateform after 2015. The current usage metrics is available 48-96 hours after online publication and is updated daily on week days.
Initial download of the metrics may take a while.