Fig. 7.
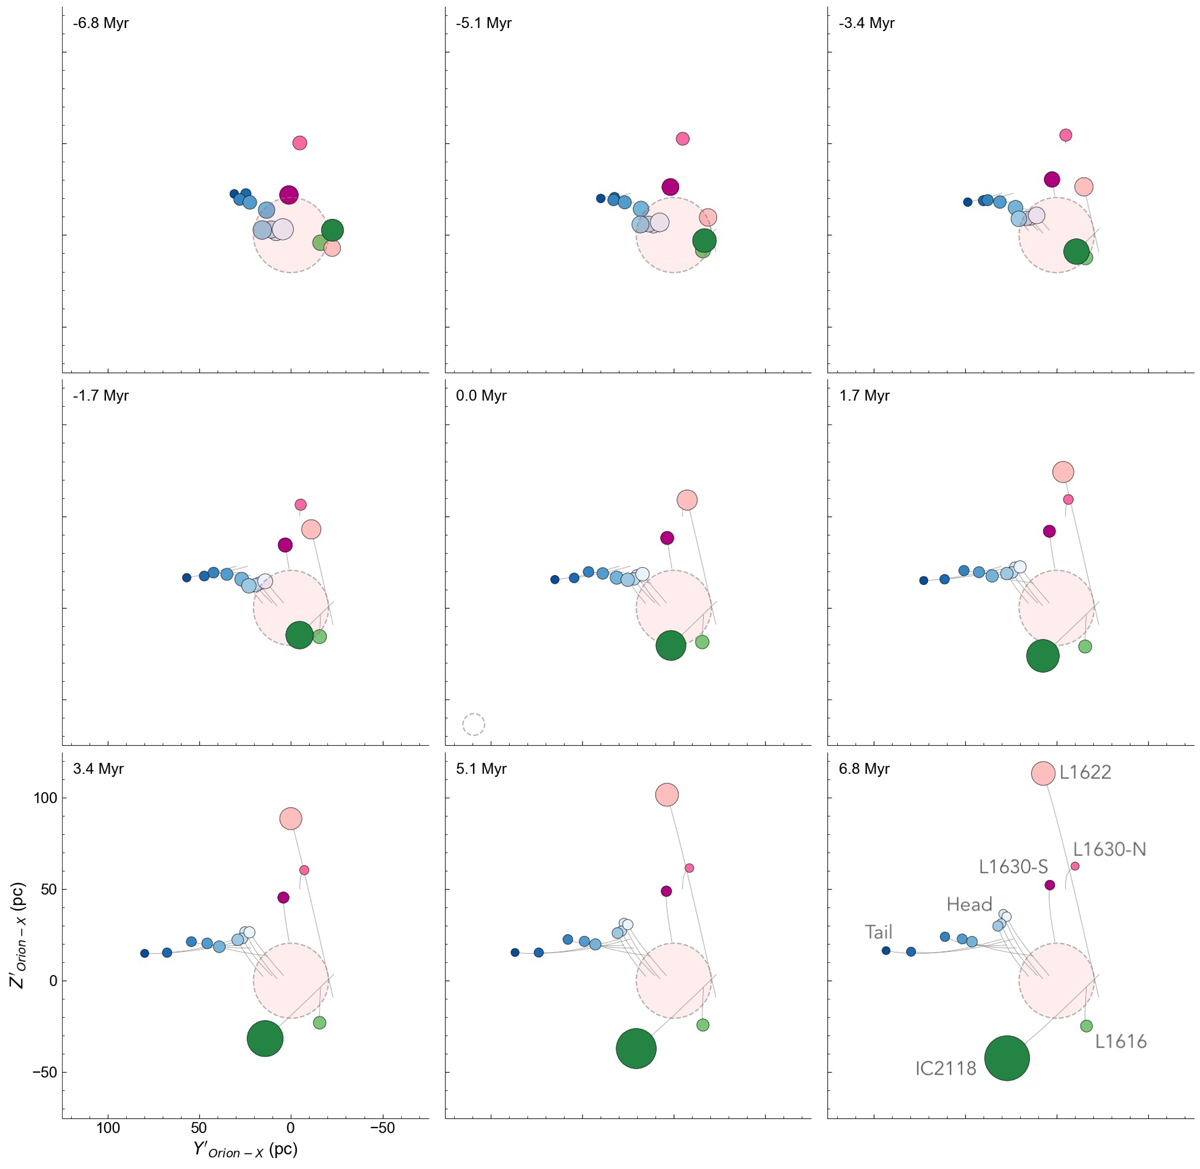
Nine time-snapshots showing the relative motions of the subregions in ![]() vs
vs ![]() from −6.8 to 6.8 Myr. This projection represents a face-on view of Orion as viewed from the Sun. The x-axis of the coordinate system points toward (l, b) = (206.038° , − 21.945° ). This is the average position of the cluster Orion X (Chen et al. 2020). Its extent is shown by the red disk in the center with a gray dashed outline. The 14 subregions are shown as filled circles (colored as in Fig. 1) and labeled in the last panel (for Orion A only head and tail are indicated). The symbol sizes are scaled with distance (along the 3rd axis) and are normalized relative to the gray-dashed open circle given in the lower-left corner of central panel (circle size normalized for Orion X); larger points are in-front and smaller points in the back of Orion X, to give an impression of depth. The symbol sizes are scaled for each projection individually and are not comparable between Figs. 7–9. See text for more information. A movie version is available online. See also Fig. 10 for an interactive version.
from −6.8 to 6.8 Myr. This projection represents a face-on view of Orion as viewed from the Sun. The x-axis of the coordinate system points toward (l, b) = (206.038° , − 21.945° ). This is the average position of the cluster Orion X (Chen et al. 2020). Its extent is shown by the red disk in the center with a gray dashed outline. The 14 subregions are shown as filled circles (colored as in Fig. 1) and labeled in the last panel (for Orion A only head and tail are indicated). The symbol sizes are scaled with distance (along the 3rd axis) and are normalized relative to the gray-dashed open circle given in the lower-left corner of central panel (circle size normalized for Orion X); larger points are in-front and smaller points in the back of Orion X, to give an impression of depth. The symbol sizes are scaled for each projection individually and are not comparable between Figs. 7–9. See text for more information. A movie version is available online. See also Fig. 10 for an interactive version.
Current usage metrics show cumulative count of Article Views (full-text article views including HTML views, PDF and ePub downloads, according to the available data) and Abstracts Views on Vision4Press platform.
Data correspond to usage on the plateform after 2015. The current usage metrics is available 48-96 hours after online publication and is updated daily on week days.
Initial download of the metrics may take a while.