Fig. 5.
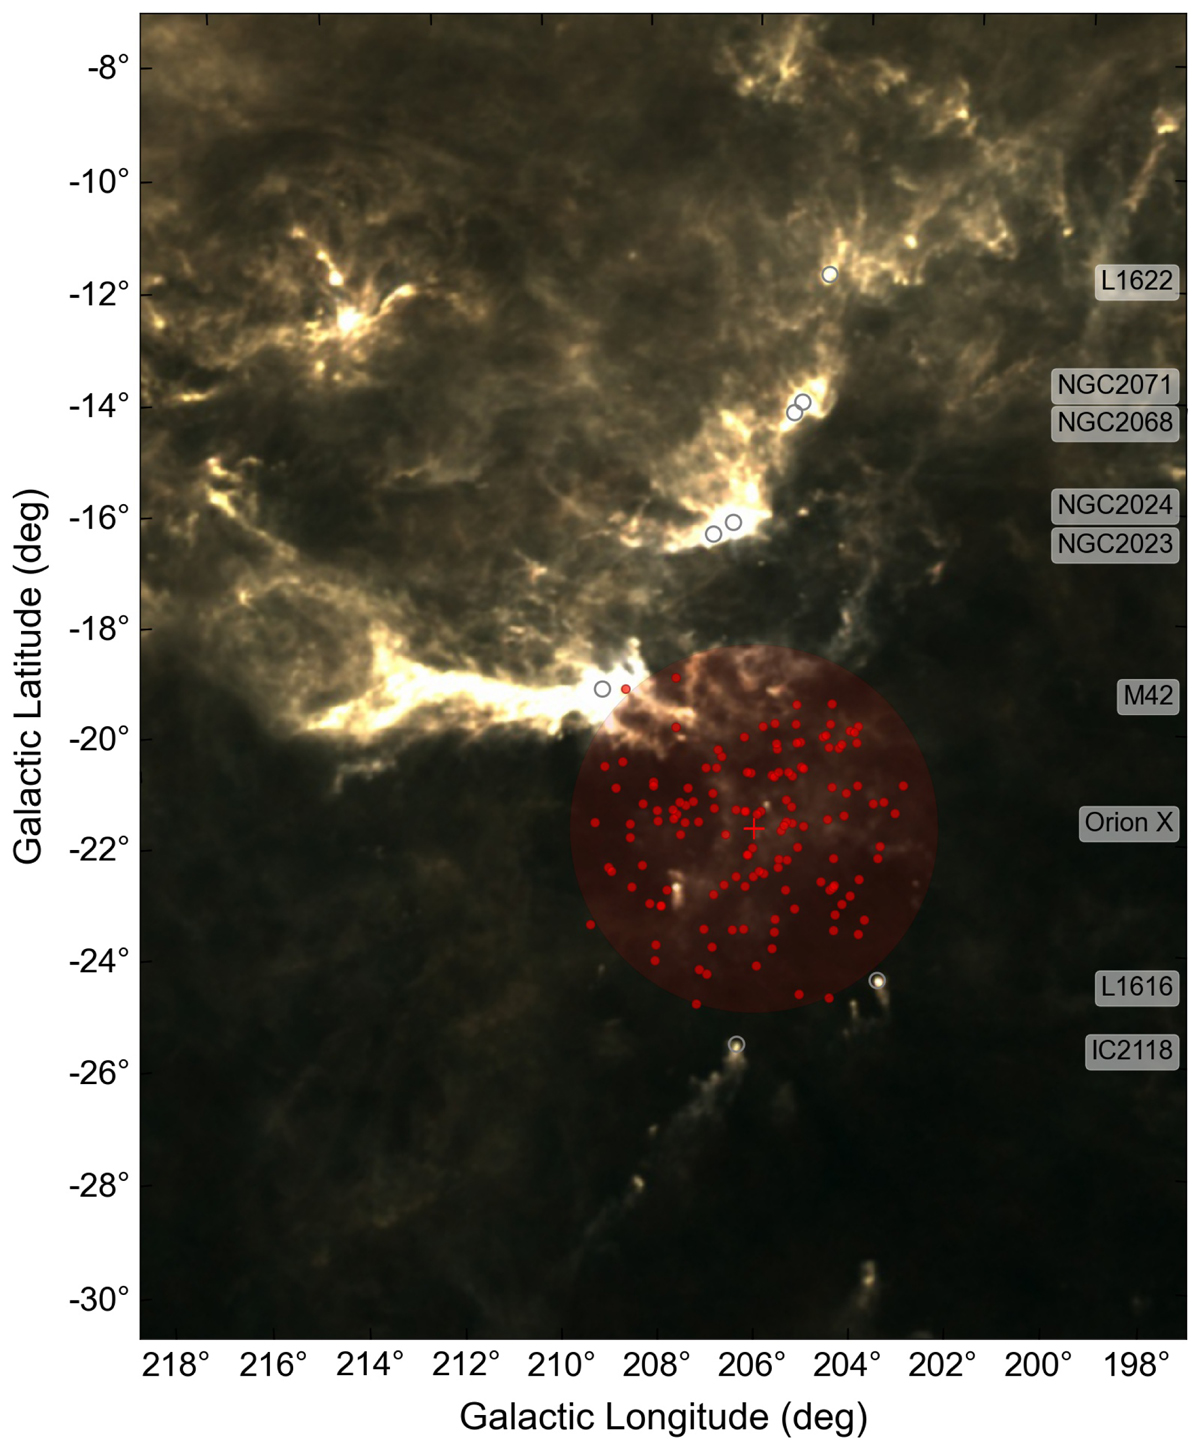
Planck HFI composite (Planck Collaboration XI 2014) showing an overview of the Orion molecular cloud complex. Because of its sensitivity and dynamic range, the Planck image shows clearly the wind-blown appearance of the molecular gas in this whole region, shaped by the feedback of massive stars. The small gray open circles mark the investigated regions, with corresponding labels on the right. In Orion A only the position of M42 is indicated, and in Orion B the clusters are labeled separately. The large red filled circle encloses the position of the cluster Orion X (Bouy & Alves 2015), with a diameter of about 7° (∼40 pc at the cluster’s average distance of ∼325 pc). The individual stellar members of the cluster (from Chen et al. 2020) are represented as red dots.
Current usage metrics show cumulative count of Article Views (full-text article views including HTML views, PDF and ePub downloads, according to the available data) and Abstracts Views on Vision4Press platform.
Data correspond to usage on the plateform after 2015. The current usage metrics is available 48-96 hours after online publication and is updated daily on week days.
Initial download of the metrics may take a while.