Fig. 2.
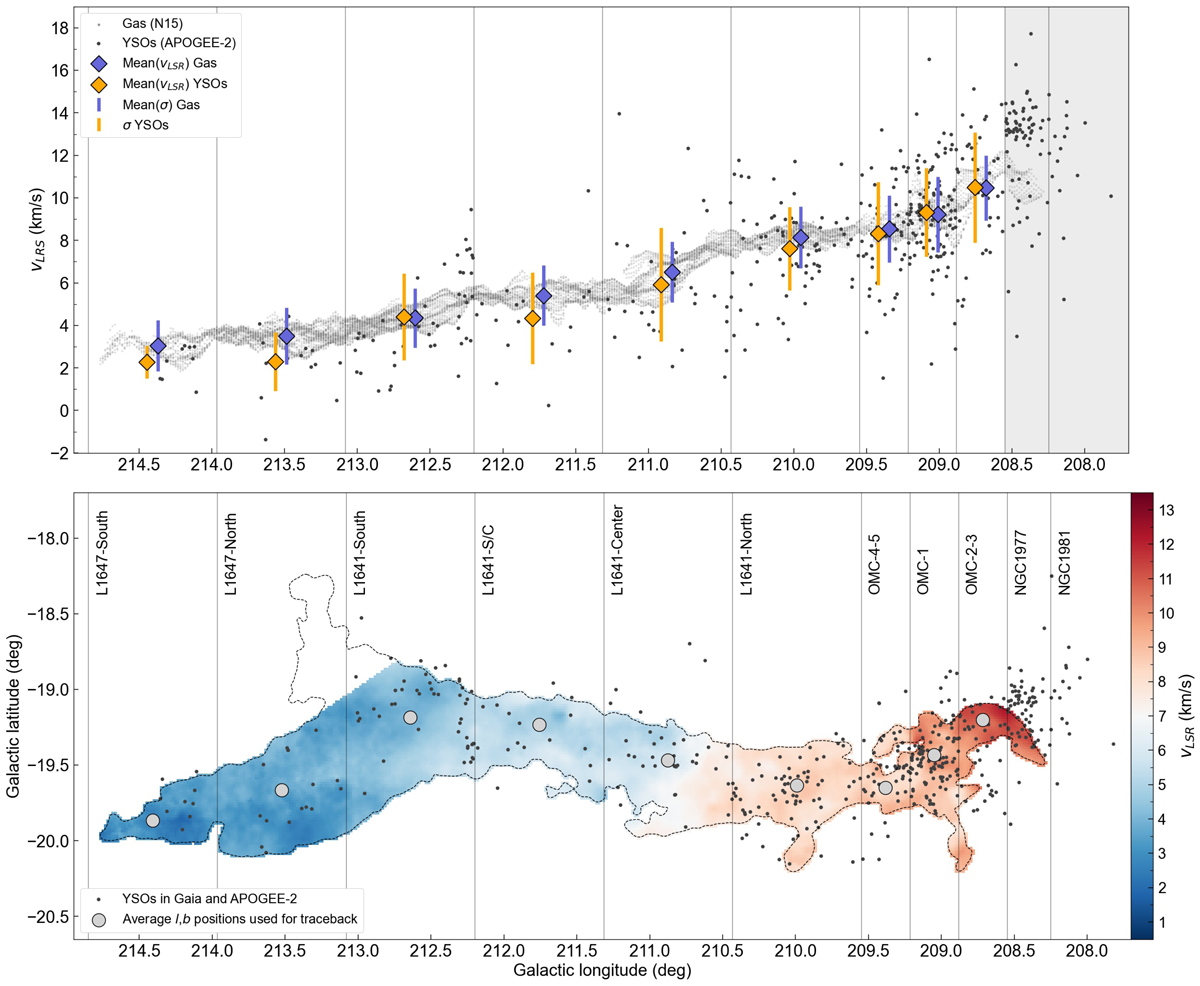
Determination of average line of sight motions for Orion A. Top: PV-diagram (vLSR vs l) for gas and YSOs in Orion A. The gas velocities (gray small dots) were extracted as the 1st Moment of the 12CO(2-1) map from Nishimura et al. (2015). Only pixels within a smoothed column-density contour of AK > 0.5 mag were used to avoid contamination by background emission. The black dots show the selected YSO sample that satisfies the Gaia and APOGEE-2 quality criteria. The averages per region for YSOs and gas are shown with orange and blue diamonds, respectively, with the error bars representing the velocity dispersion per region (see also Fig. E.1). The l-positions of these symbols were shifted from mid-bin-positions for better visibility. Bottom: velocity map as derived from the CO measurements per pixel. The pixel values are given in vLSR, as shown by the color-scale, and were used for the PV-diagram (top panel). The nine subregions are labeled within the bins at the top of the frame, and their average l, b positions are shown as gray circles, which are used for the traceback. The bins enclosing NGC 1977 and NGC 1981 were excluded (gray shaded area, top panel), since the gas and YSOs appear decoupled.
Current usage metrics show cumulative count of Article Views (full-text article views including HTML views, PDF and ePub downloads, according to the available data) and Abstracts Views on Vision4Press platform.
Data correspond to usage on the plateform after 2015. The current usage metrics is available 48-96 hours after online publication and is updated daily on week days.
Initial download of the metrics may take a while.