Fig. E.1.
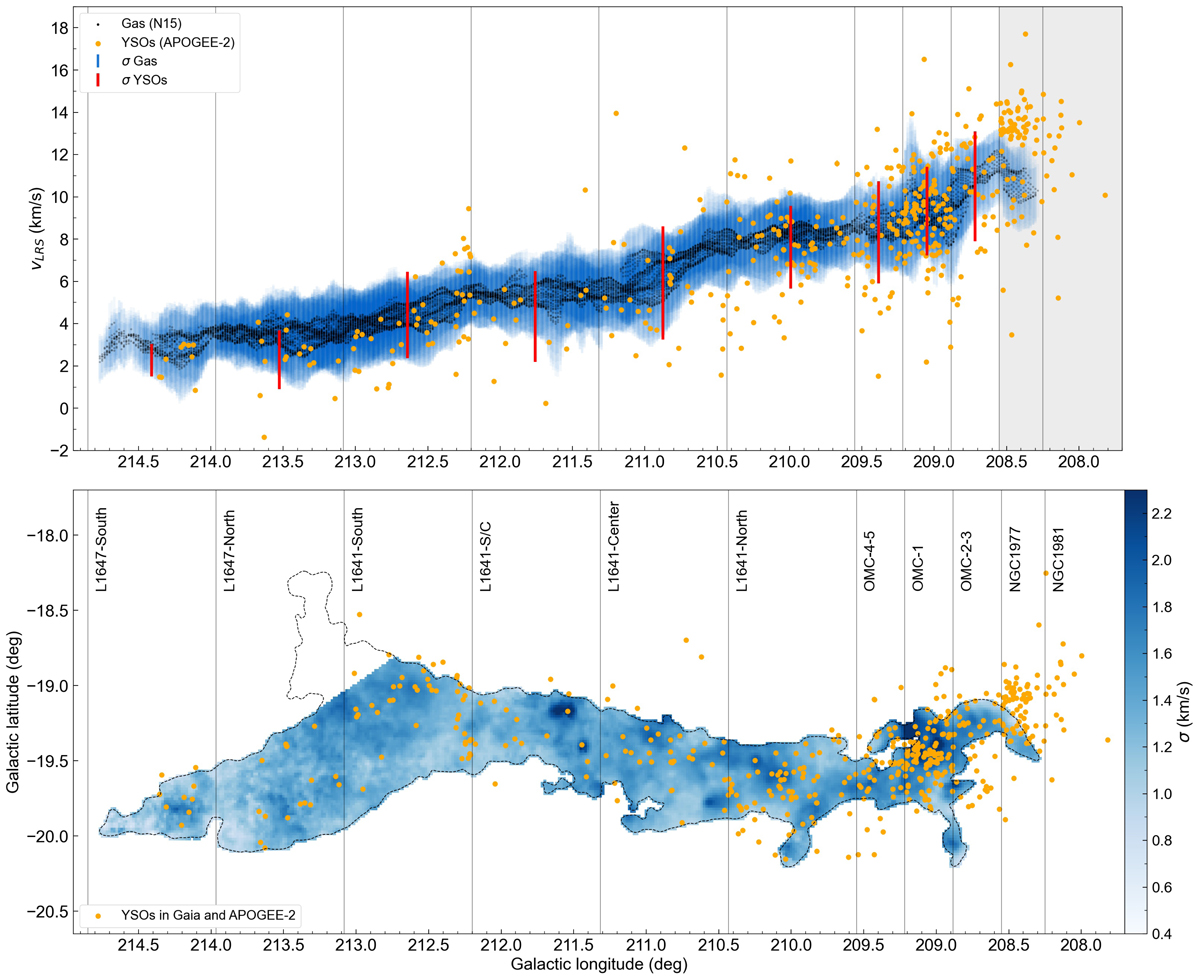
Velocity dispersion in Orion A. Top: PV-diagram (vLSR vs l) for CO gas and YSOs in Orion A (see also Fig. 2). The blue error bars represent the one-sigma velocity dispersion of the gas for each line of sight. Over-plotted are the YSOs (orange) and their velocity dispersion per region (red bars) for comparison. Bottom: sigma map, showing the velocity dispersion for each pixel in blue color scale. Over-plotted are the YSOs as orange dots. The velocity dispersion variations show that there are regions with relatively higher σ (dark-blue). Such regions often correspond to cluster regions or regions of higher column-density. See Fig. 2 and text (Sect. 2.2) for more explanations.
Current usage metrics show cumulative count of Article Views (full-text article views including HTML views, PDF and ePub downloads, according to the available data) and Abstracts Views on Vision4Press platform.
Data correspond to usage on the plateform after 2015. The current usage metrics is available 48-96 hours after online publication and is updated daily on week days.
Initial download of the metrics may take a while.