Fig. 12.
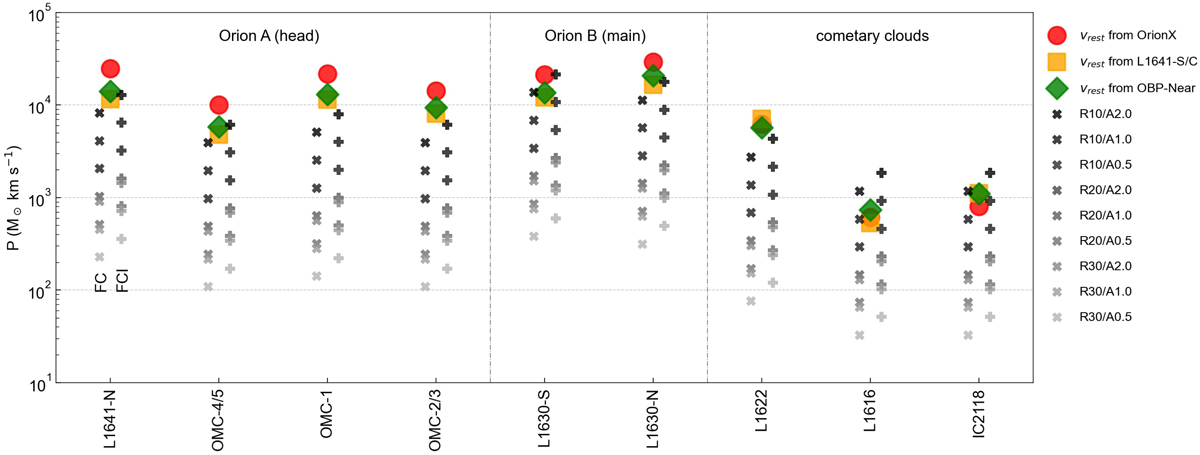
Momentum analysis for nine subregions. The momenta were calculated assuming three different rest velocities (from Orion X, red circles; L1641-S/C, orange boxes; OBP-Near, green diamonds) to calculate the relative velocities of the selected cloud parts. Additionally, theoretical estimates are shown as gray-shaded cross and plus symbols as determined from simulations by Walch & Naab (2015). The short-cuts in the legend indicate nine different cases: First, the supernova shell radius (R) was set to 10 pc, 20 pc, and 30 pc at time of impact on the cloud. Second, the affected cloud areas (solid angle as seen from source of explosion) were varied as follows; case A1.0 uses the projected observed cloud surface area at the cloud’s distance (Appendix D), and cases A2.0 and A0.5 use twice and half of the projected area, respectively. The simulation run FC (fractal+cooling) was set up for a fractal cloud with an average density of n0 = 100 cm−3, including cooling, and is shown representatively with cross-symbols in the legend for the nine different cases. The plus symbols are shown for the same cases, but for a model that includes initial ionization from the supernova progenitor star (FCI). See text for more explanations.
Current usage metrics show cumulative count of Article Views (full-text article views including HTML views, PDF and ePub downloads, according to the available data) and Abstracts Views on Vision4Press platform.
Data correspond to usage on the plateform after 2015. The current usage metrics is available 48-96 hours after online publication and is updated daily on week days.
Initial download of the metrics may take a while.