Fig. 11.
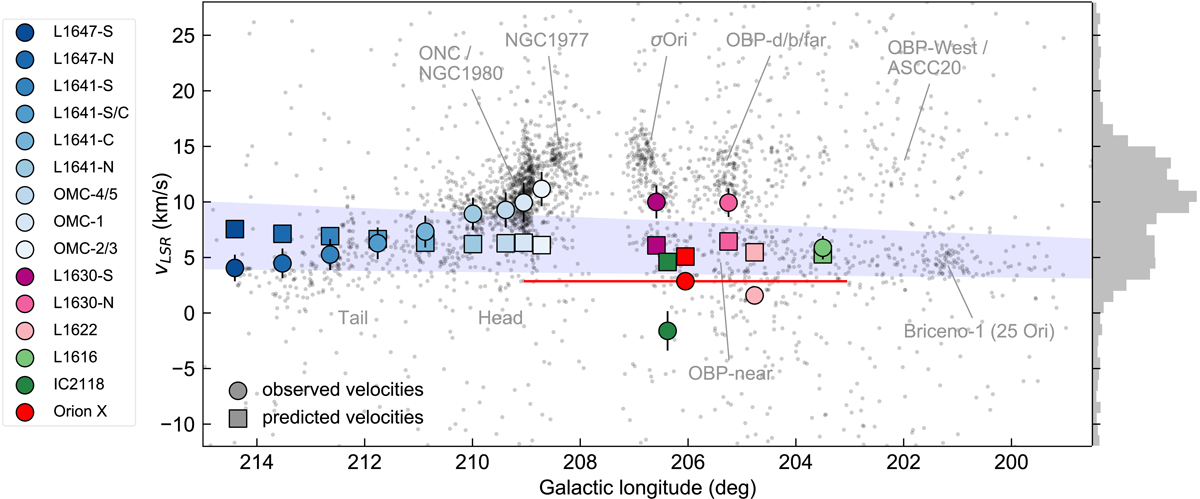
Position-velocity diagram (vLSR vs l) for APOGEE-2 observed sources in the southern Orion region. The 14 subregions are shown as colored circles (see legend and Fig. 1), with the error bars representing the velocity dispersion (Table 3). The red circle indicates the average position and velocity of Orion X in this PV-space (error bar smaller than the symbol size), with the red horizontal bar showing the projected l-extent of the scatter of known group members (Chen et al. 2020). The box-symbols represent the predicted PV-position of each corresponding cloud, if they were following the Galactic rotation curve without perturbation. The blue shaded area is shown as reference and encloses predicted motions for objects that are located between 200 pc < d < 600 pc, 215° > l > 198.5°, and −27° < b < −11°. For orientation we labeled the head and tail of Orion A, as well as other well-known stellar groups visible as over-densities in the PV-scatter (see Sect. 5.3). The distribution of vLSR motions is presented in the histogram on the right, which is bimodal with one peak centered at about 5 km s−1 and another between 10 and 15 km s−1. The latter is dominated by the ONC and other young stellar groups. The gap in the middle (l ∼ 207.5) is largely caused by data incompleteness in APOGEE-2, in combination with a lack of stellar clusterings in this region.
Current usage metrics show cumulative count of Article Views (full-text article views including HTML views, PDF and ePub downloads, according to the available data) and Abstracts Views on Vision4Press platform.
Data correspond to usage on the plateform after 2015. The current usage metrics is available 48-96 hours after online publication and is updated daily on week days.
Initial download of the metrics may take a while.