Fig. 10.
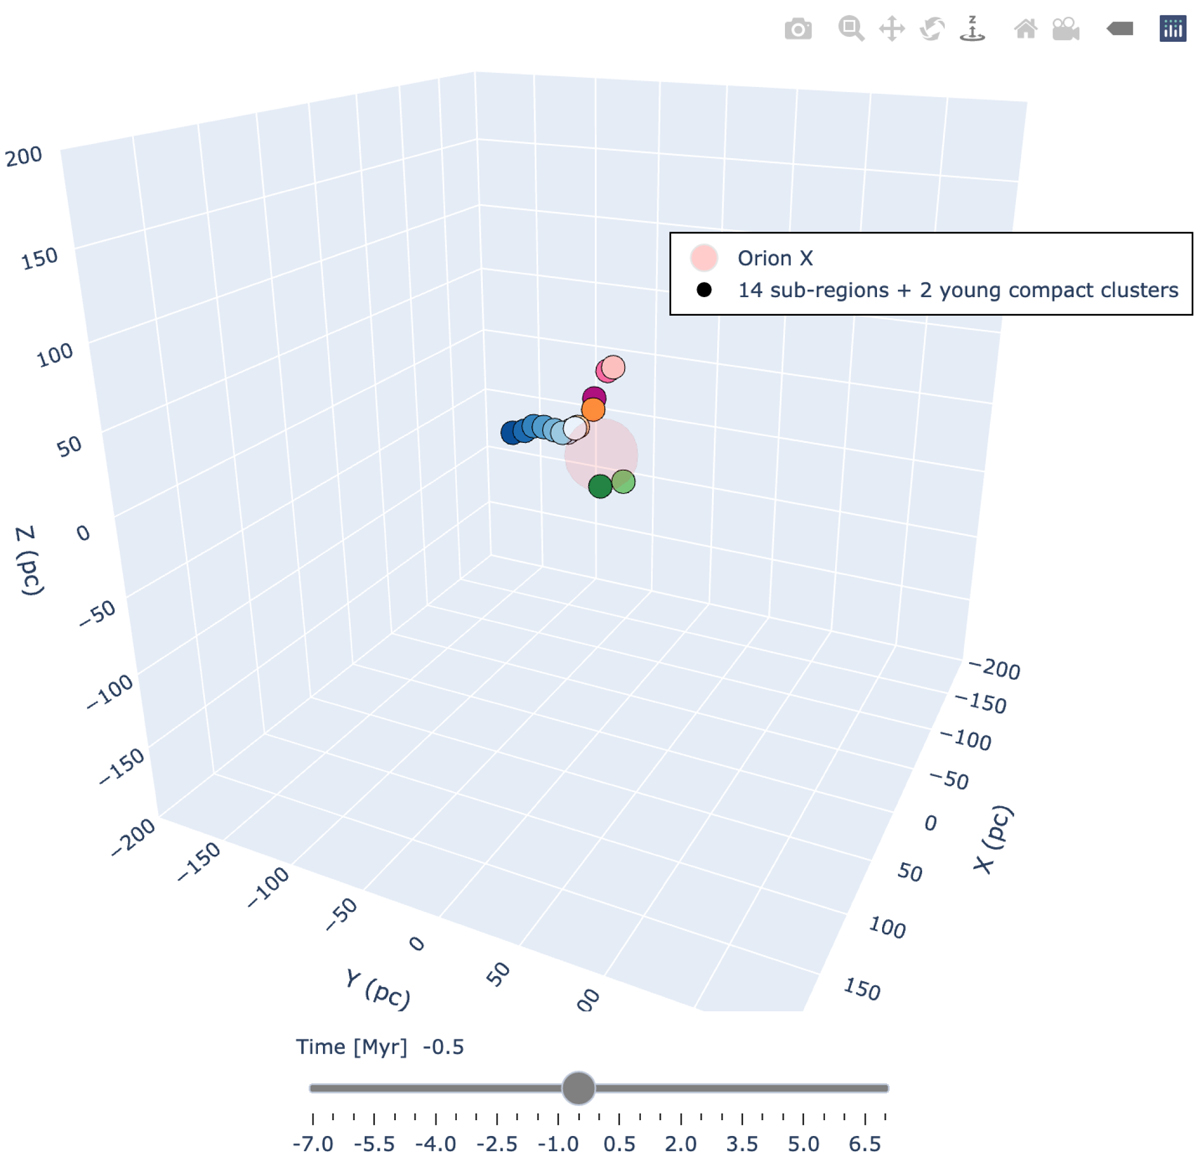
Interactive 3D scatter plot in Galactic Cartesian coordinates centered on Orion X. Shown is a snapshot at time = 0 Myr, positioned to represent the view from the Sun toward Orion. The interactive plot includes a timeslider for −7 to +7 Myr and shows the relative positions and motions of the Orion subregions over this time span, allowing a 3D investigation of the evolution of the region. Symbols and colors are the same as in Figs. 1, 7–9, and B.1. The figure includes the positions and motions of two young compact clusters, NGC 1977 and σ Ori, as further discussed in Sect. 5.3 and Appendix B. The interactive 3D version is available online.
Current usage metrics show cumulative count of Article Views (full-text article views including HTML views, PDF and ePub downloads, according to the available data) and Abstracts Views on Vision4Press platform.
Data correspond to usage on the plateform after 2015. The current usage metrics is available 48-96 hours after online publication and is updated daily on week days.
Initial download of the metrics may take a while.