Fig. 1.
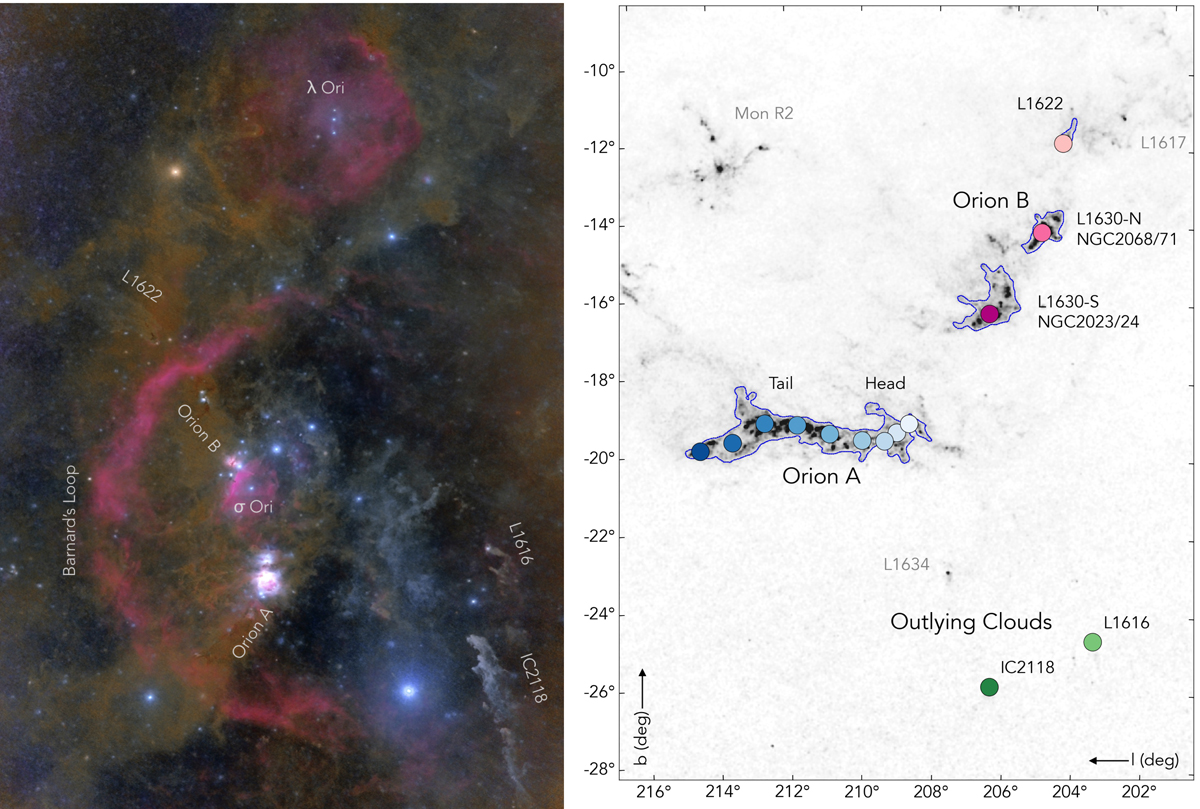
Overview of the Orion molecular cloud complex. Left: optical image of the Orion region (orientation roughly equatorial). Captured from deep in the heart of the Kalahari desert by Chris Beere (https://www.astrobin.com/users/chrisbeere. Color in this optical image is as shot with custom white balance, processed with Starnet++ to highlight extended structures). This image highlights well the interplay between the large-scale nebula and the dusty structures. L1622 shows a large tail of scattered light that is clearly distinct from the background. Right: overview of the studied subregions in galactic orientation. The gray-scale shows regions of high extinction from a 2MASS near-infrared extinction map (NICER, Lombardi et al. 2011) (AK-range shown from 0 to 1.4 mag). The blue contours are smoothed extinction contours (at AK = 0.42 mag), only shown for the molecular clouds of interest. The colored circles are the center locations of the selected 14 subregions within the three main regions: Orion A (blue), Orion B (magenta), and the two outlying cometary clouds (green, the green circles hide the blue contours of the small cometary clouds). Additional regions are labeled for completeness in gray. The color-scaling of the filled circles is used throughout the paper to identify the subregions within the clouds.
Current usage metrics show cumulative count of Article Views (full-text article views including HTML views, PDF and ePub downloads, according to the available data) and Abstracts Views on Vision4Press platform.
Data correspond to usage on the plateform after 2015. The current usage metrics is available 48-96 hours after online publication and is updated daily on week days.
Initial download of the metrics may take a while.