Fig. 8.
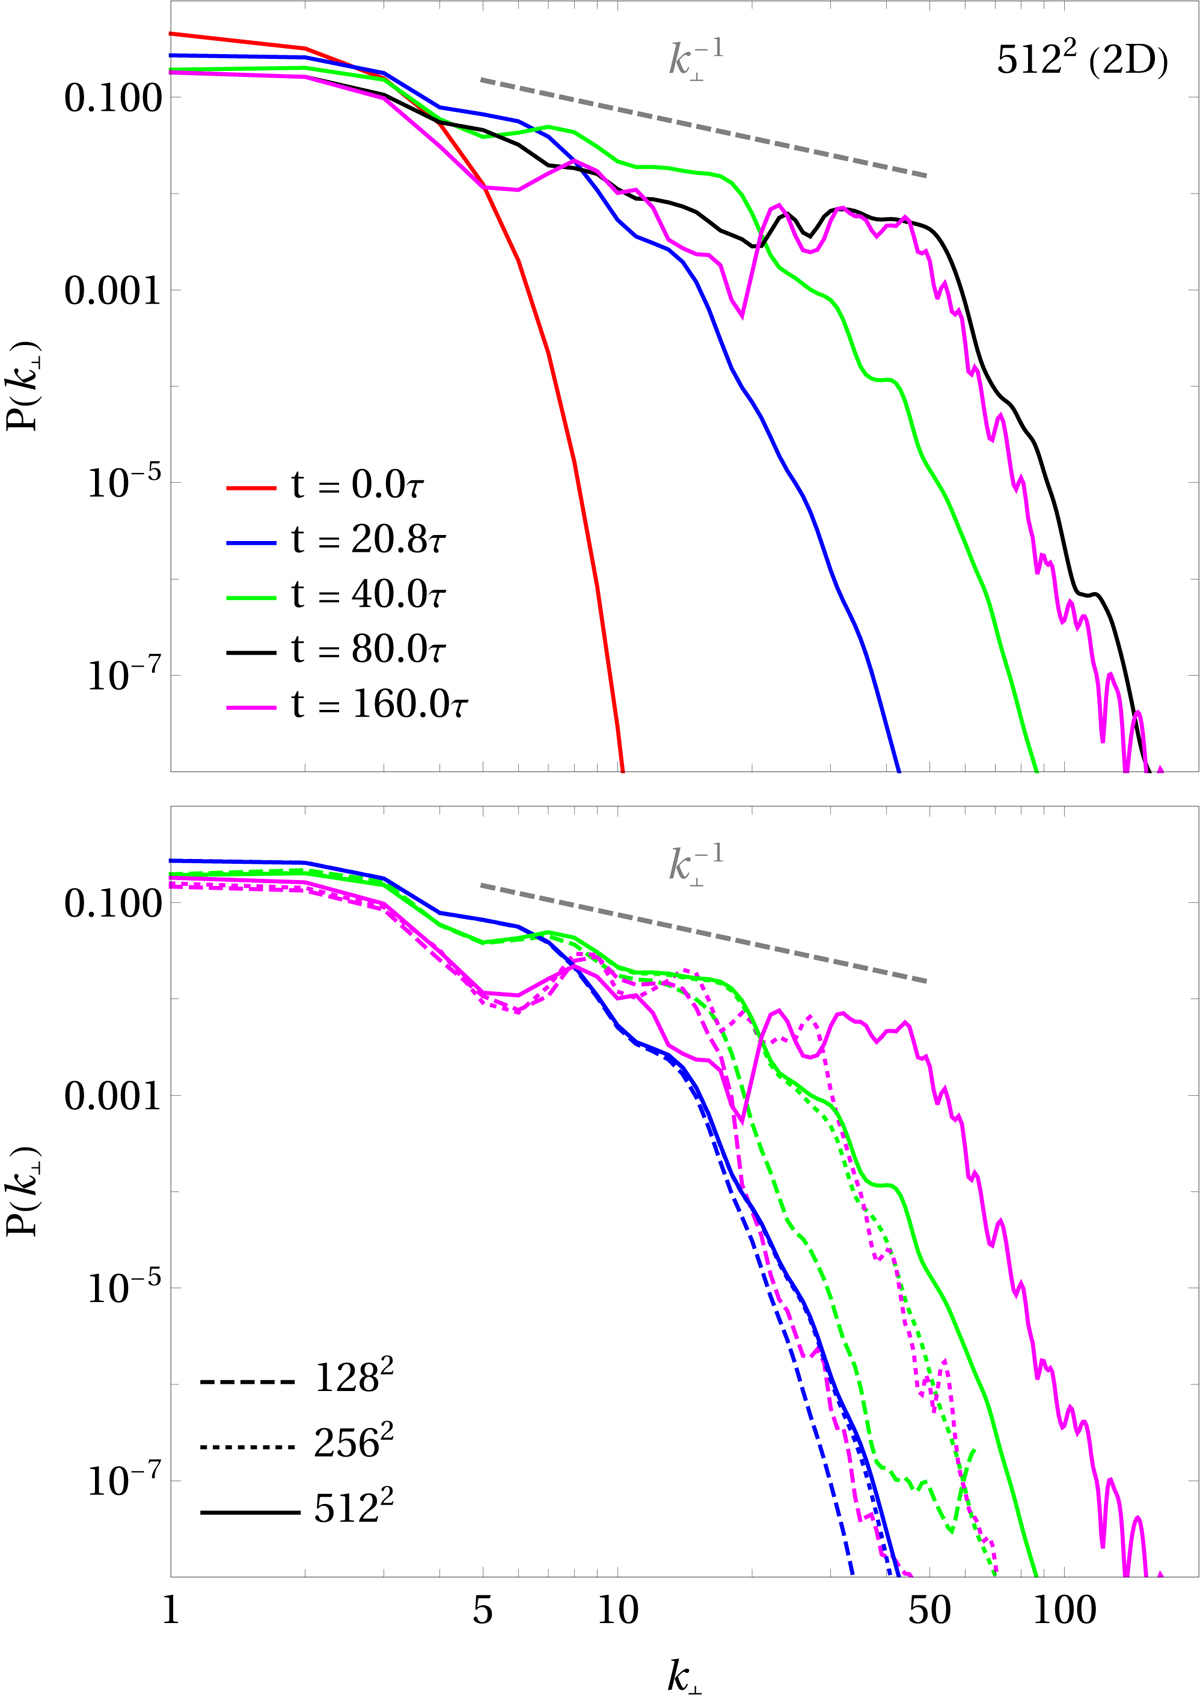
Spectrum evolution for the 2D simulation of Alfvén interactions initialized according to Eq. (78). We show the spectral energy distribution for wavenumbers k⊥ (perpendicular to the guide field) in analogy to Fig. 6, Li et al. (2019). Top: spectral energy distribution at different times for the resolution 5122. Bottom: spectral energy distribution for selected times and wavenumbers (color code as in top panel) and different resolutions, indicated by dashed (1282), dotted (2562) and solid (5122) lines. No visible convergence is reached.
Current usage metrics show cumulative count of Article Views (full-text article views including HTML views, PDF and ePub downloads, according to the available data) and Abstracts Views on Vision4Press platform.
Data correspond to usage on the plateform after 2015. The current usage metrics is available 48-96 hours after online publication and is updated daily on week days.
Initial download of the metrics may take a while.