Fig. 12.
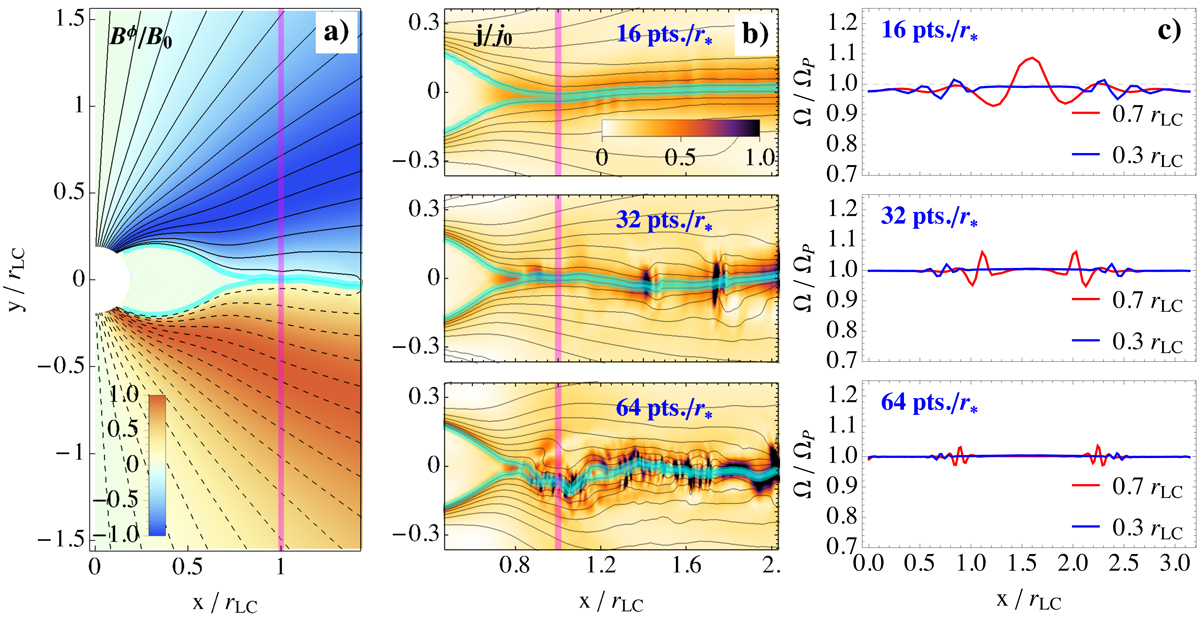
Force-free aligned rotator test in spherical ideal FFE for different resolutions. Left panel a: global structure of the magnetosphere for intermediate resolution (32 pts./r*). The poloidal fieldlines are indicated by black solid and dashed lines, depending on the magnetic field direction. Blue and red colors represent direction and magnitude of the toroidal magnetic field (normalized to its maximum value). Middle panel b: zoom on the Y-point and equatorial current sheet (alternating magnetic field highlighted by cyan field lines) for different resolutions. The color scale represents the current density (normalized to the current density of the low-resolution data). Left panel c: field line angular velocity measured at different radii.
Current usage metrics show cumulative count of Article Views (full-text article views including HTML views, PDF and ePub downloads, according to the available data) and Abstracts Views on Vision4Press platform.
Data correspond to usage on the plateform after 2015. The current usage metrics is available 48-96 hours after online publication and is updated daily on week days.
Initial download of the metrics may take a while.