Fig. 9.
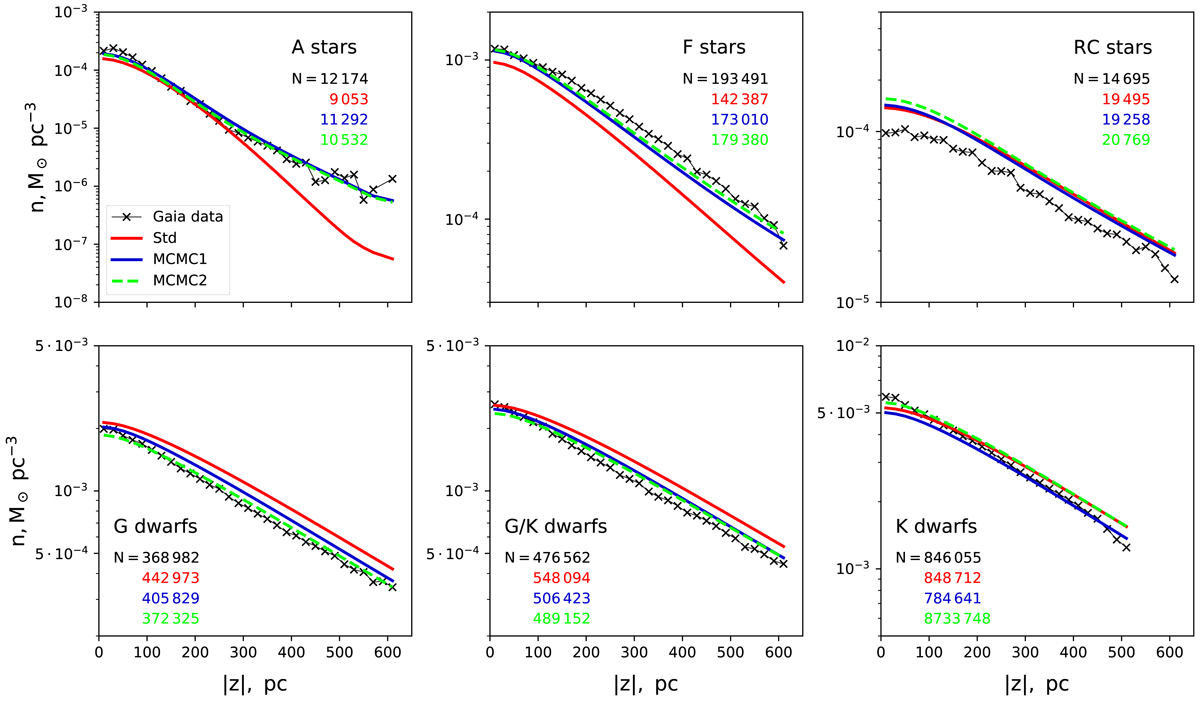
Vertical number density profiles of the six local Gaia samples. The data are plotted with black crosses. The solid red and blue curves show predictions of the standard and MCMC1 JJ models. The number density profiles of the MCMC2 model are shown with dashed green lines. The observed and modelled number of stars in each sample are given with the same colour coding. The scale and range of y-axis are chosen different for all panels in order to show clearly the shapes of all profiles.
Current usage metrics show cumulative count of Article Views (full-text article views including HTML views, PDF and ePub downloads, according to the available data) and Abstracts Views on Vision4Press platform.
Data correspond to usage on the plateform after 2015. The current usage metrics is available 48-96 hours after online publication and is updated daily on week days.
Initial download of the metrics may take a while.