Fig. 8.
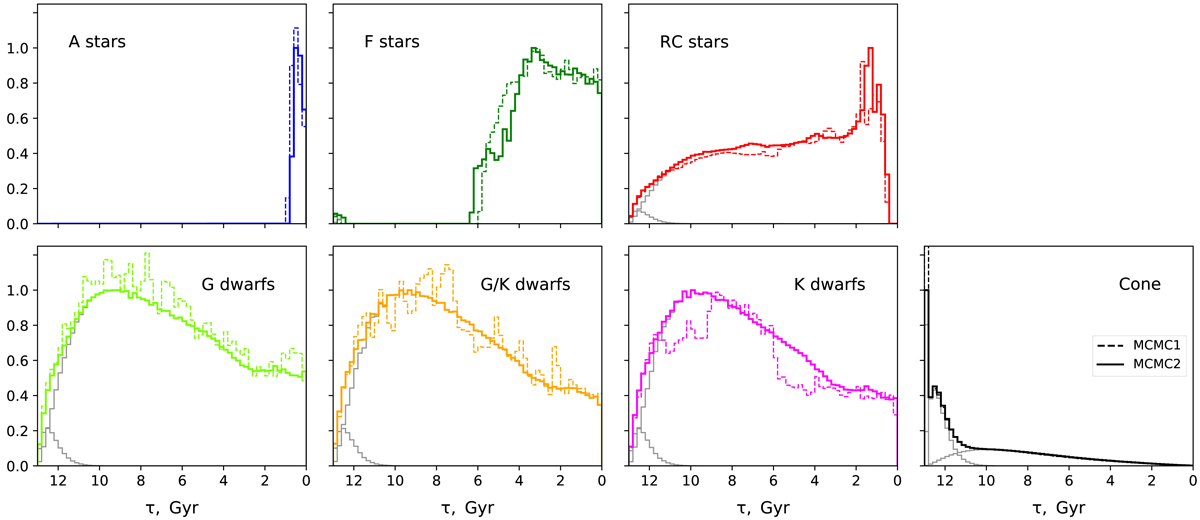
Age distributions of the Gaia samples used for the optimisation of the model parameters θ. Dashed and solid coloured lines correspond to the predictions obtained with the set of MCMC1 and MCMC2 model parameters, respectively. Grey histograms show the relative contributions of the halo, thick-, and thin-disk components (τ = 13 Gyr, 13 Gyr > τ > 9 Gyr, and all ages, respectively). The samples are typically dominated by the thin-disk stars, e.g. the overall age distributions of A and F stars essentially coincide with the thin-disk contributions, as the thick disk and halo entirely or almost entirely miss in this case. The only sample with a considerable fraction of the thick-disk and halo (∼50%) consists of the stars selected towards the Galactic poles (lower-right panel, also see Fig. 11).
Current usage metrics show cumulative count of Article Views (full-text article views including HTML views, PDF and ePub downloads, according to the available data) and Abstracts Views on Vision4Press platform.
Data correspond to usage on the plateform after 2015. The current usage metrics is available 48-96 hours after online publication and is updated daily on week days.
Initial download of the metrics may take a while.