Fig. 7.
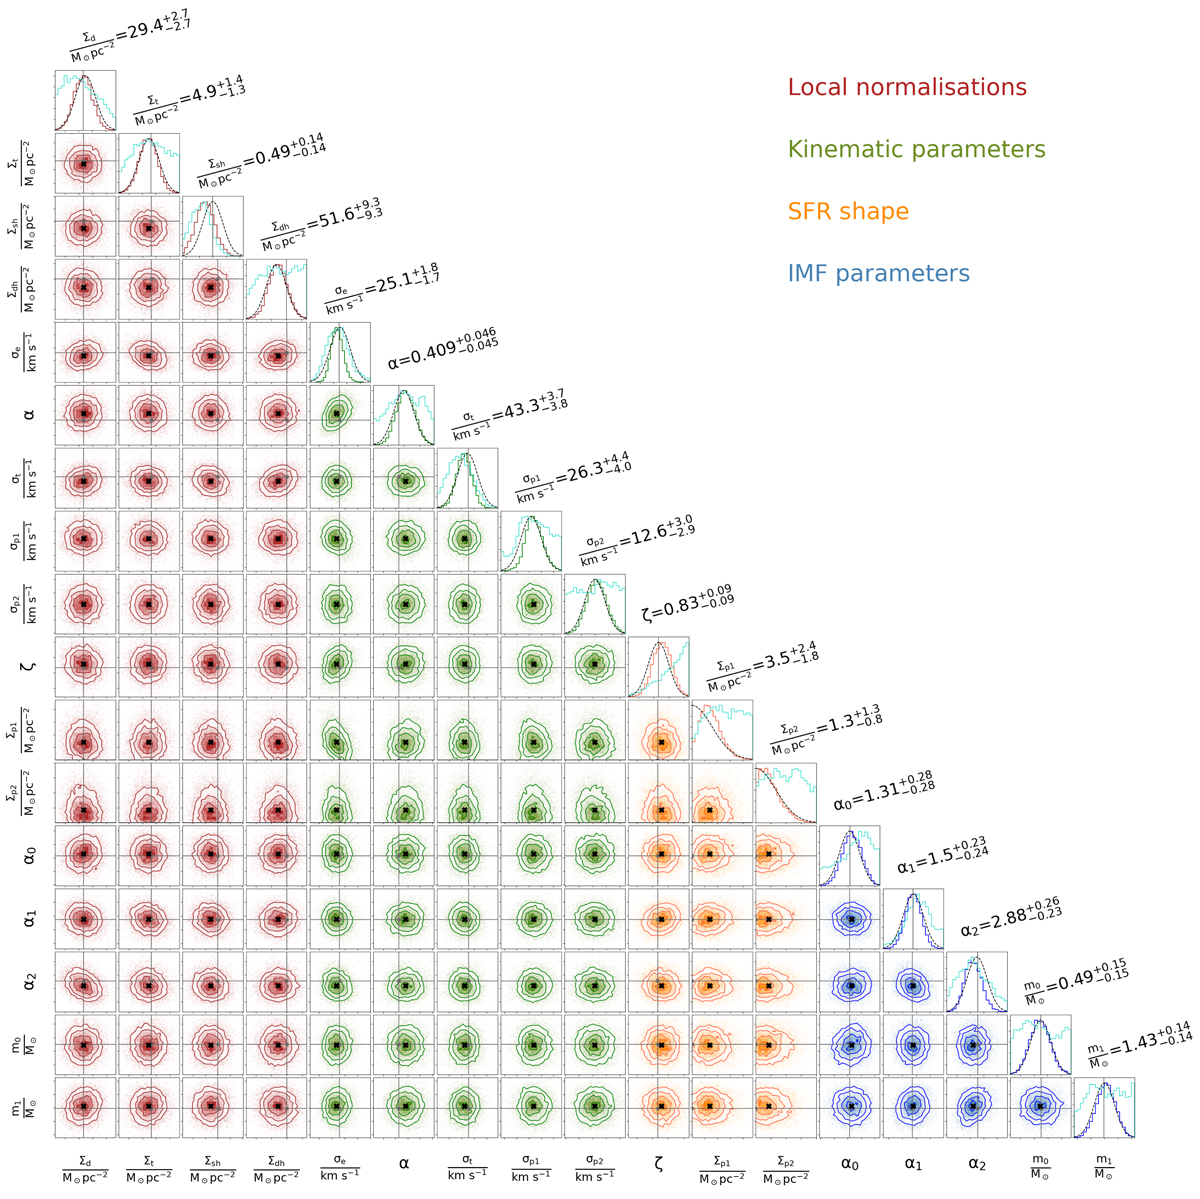
Posterior PDF marginalised over the least important parameters from the set θ. The probability distribution is sampled during the MCMC1 simulation. Thin grey lines mark the standard values of parameters θ0 and black crosses show their new best values. Histograms on the plot diagonal show each parameter PDF (coloured steps), Gaussian priors (dashed black curves), and the likelihood PDFs (light-blue steps).
Current usage metrics show cumulative count of Article Views (full-text article views including HTML views, PDF and ePub downloads, according to the available data) and Abstracts Views on Vision4Press platform.
Data correspond to usage on the plateform after 2015. The current usage metrics is available 48-96 hours after online publication and is updated daily on week days.
Initial download of the metrics may take a while.