Fig. B.2.
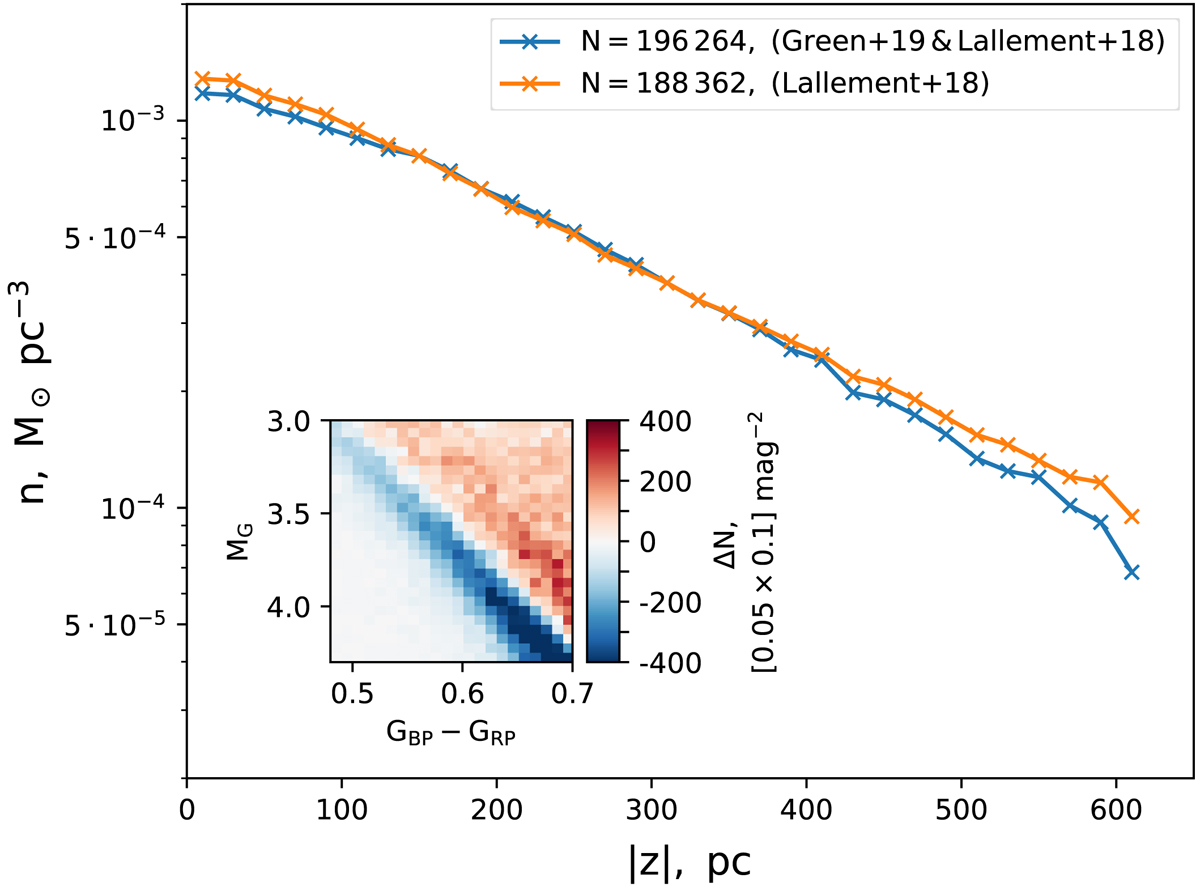
Vertical number density profiles of two F-star samples. The samples are selected in the colour-magnitude window defined in Table 1 using Gaia DR2 colours and magnitudes de-reddened with two different dust maps from Fig. B.1. The inset plot shows the absolute difference between these two F-star samples over the Hess diagram.
Current usage metrics show cumulative count of Article Views (full-text article views including HTML views, PDF and ePub downloads, according to the available data) and Abstracts Views on Vision4Press platform.
Data correspond to usage on the plateform after 2015. The current usage metrics is available 48-96 hours after online publication and is updated daily on week days.
Initial download of the metrics may take a while.