Fig. 13.
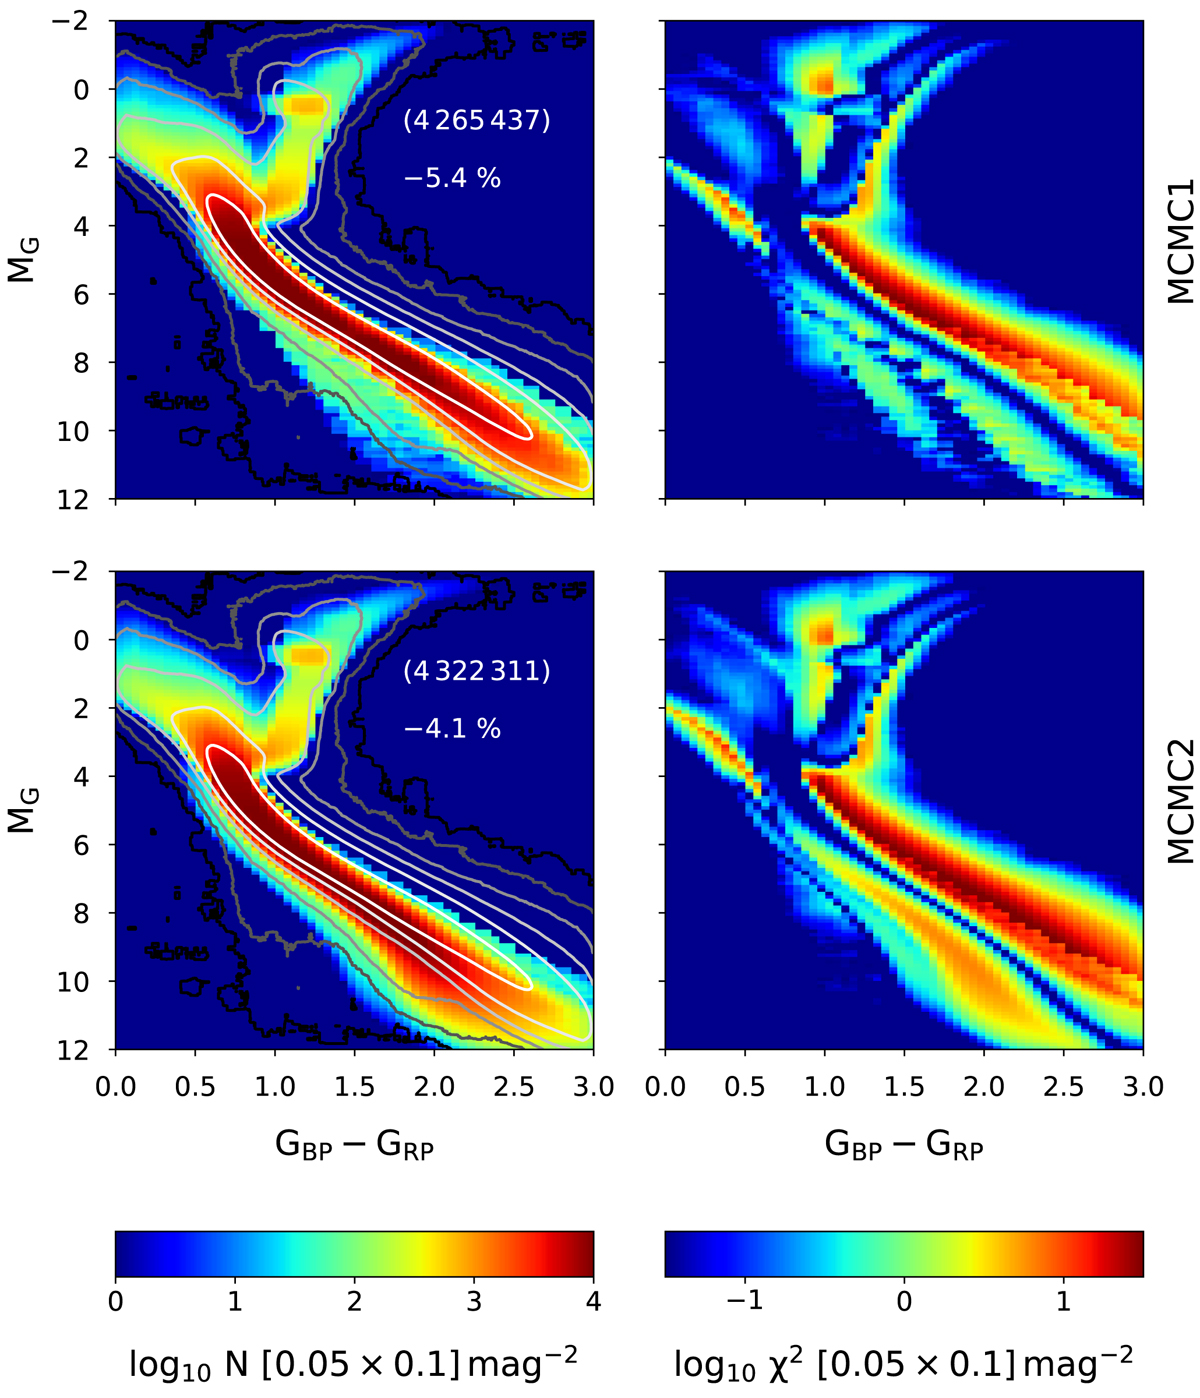
Absolute Hess diagram of the full local sample (left column) as predicted by the MCMC1 and MCMC2 models (top to bottom). The black and white contours are added for comparison and show the distribution of stars in the data. The overplotted values give the total predicted number of stars in the sample and its relative difference to the observed number of stars. The right column shows the corresponding logarithmic χ2.
Current usage metrics show cumulative count of Article Views (full-text article views including HTML views, PDF and ePub downloads, according to the available data) and Abstracts Views on Vision4Press platform.
Data correspond to usage on the plateform after 2015. The current usage metrics is available 48-96 hours after online publication and is updated daily on week days.
Initial download of the metrics may take a while.