Fig. 12.
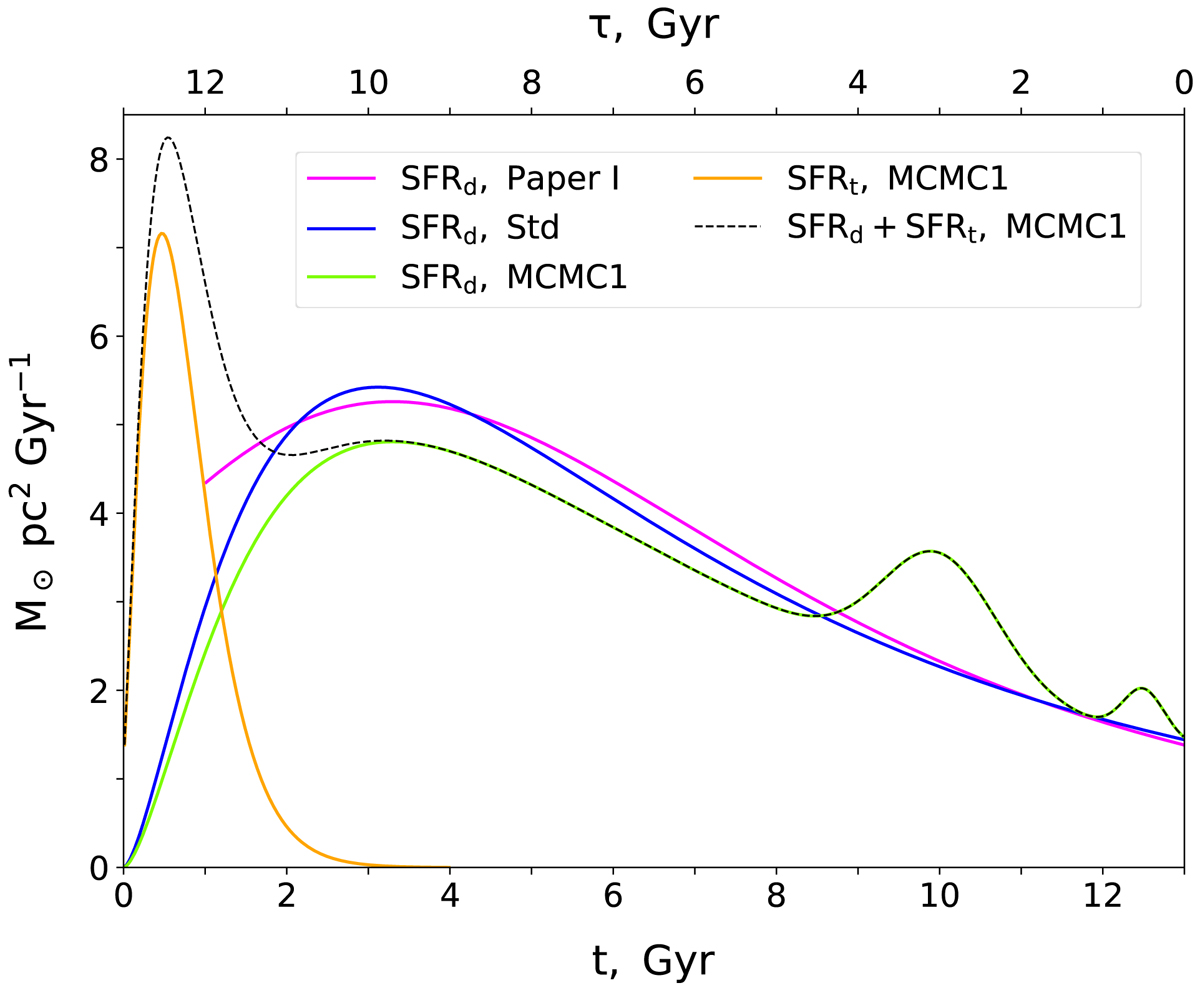
Derived SFR function of the Galactic disk at the Solar circle. Orange and green curves show the thick- and thin-disk SFR calculated according to Eqs. (7) and (12) with the parameters of the MCMC1 model. The dashed black curve is the corresponding SFR of the total disk. The thin-disk SFR of the standard model is shown in blue. For comparison, we also plot the original thin-disk SFR from Paper I (magenta curve).
Current usage metrics show cumulative count of Article Views (full-text article views including HTML views, PDF and ePub downloads, according to the available data) and Abstracts Views on Vision4Press platform.
Data correspond to usage on the plateform after 2015. The current usage metrics is available 48-96 hours after online publication and is updated daily on week days.
Initial download of the metrics may take a while.