Fig. 11.
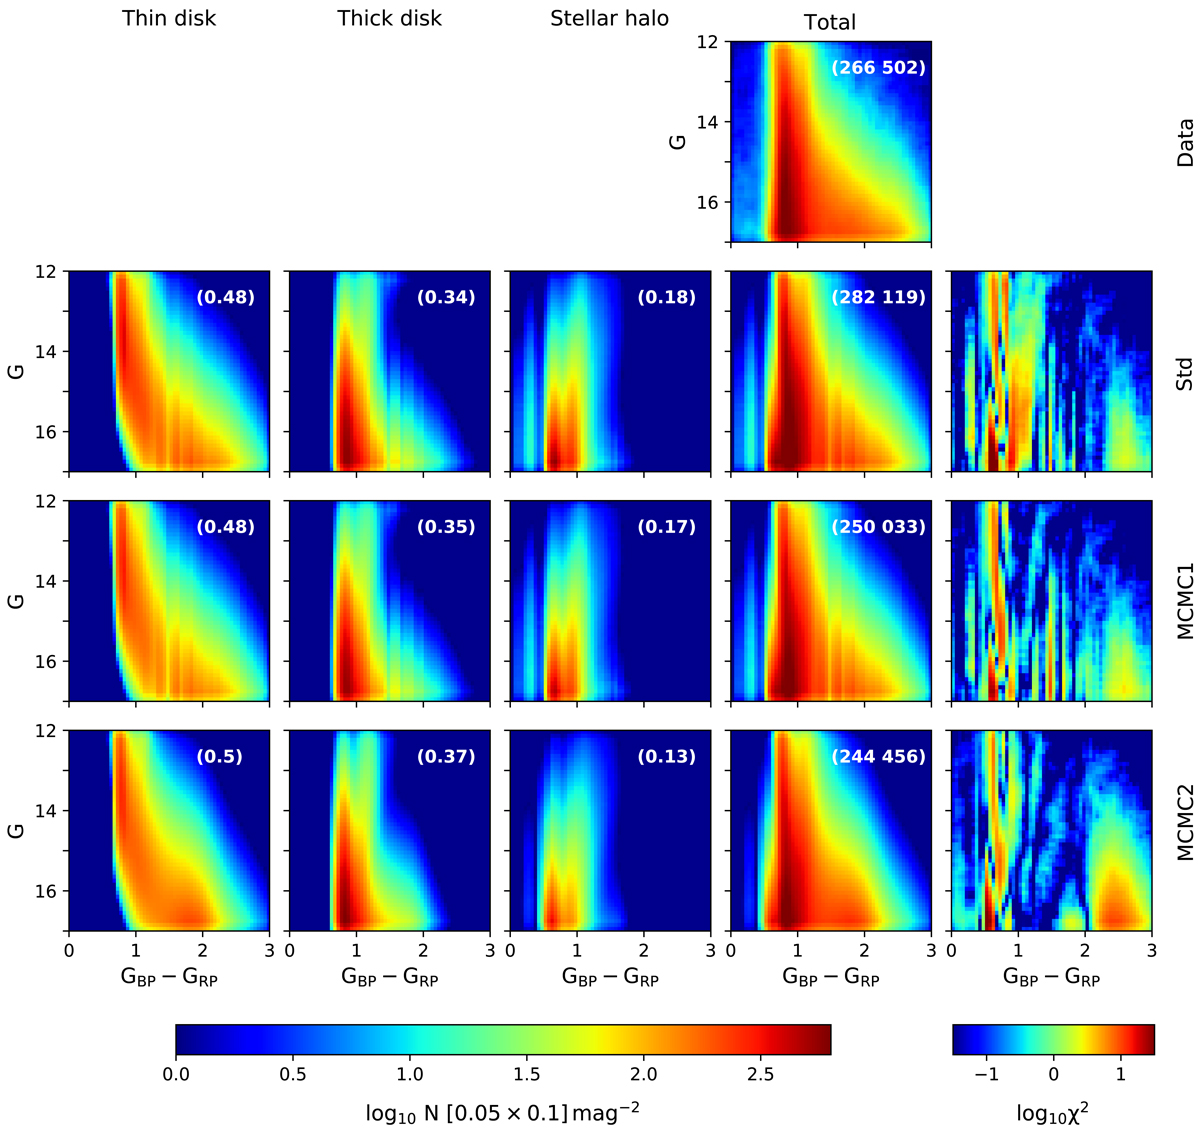
Observed and predicted smoothed apparent Hess diagram of the Gaia conic sample. Four rows (top to bottom) show the data and predictions of the standard, the MCMC1, and the MCMC2 models. The contributions of the thin and thick disk as well as of the halo are shown in three columns on the left. Values given there in parenthesis correspond to each component’s relative contribution to the total Hess diagram in terms of star counts. The fourth column shows the total Hess diagram, where the observed or modelled number of stars is given in parentheses. The last column displays the logarithmic χ2 calculated according to Eq. (28).
Current usage metrics show cumulative count of Article Views (full-text article views including HTML views, PDF and ePub downloads, according to the available data) and Abstracts Views on Vision4Press platform.
Data correspond to usage on the plateform after 2015. The current usage metrics is available 48-96 hours after online publication and is updated daily on week days.
Initial download of the metrics may take a while.