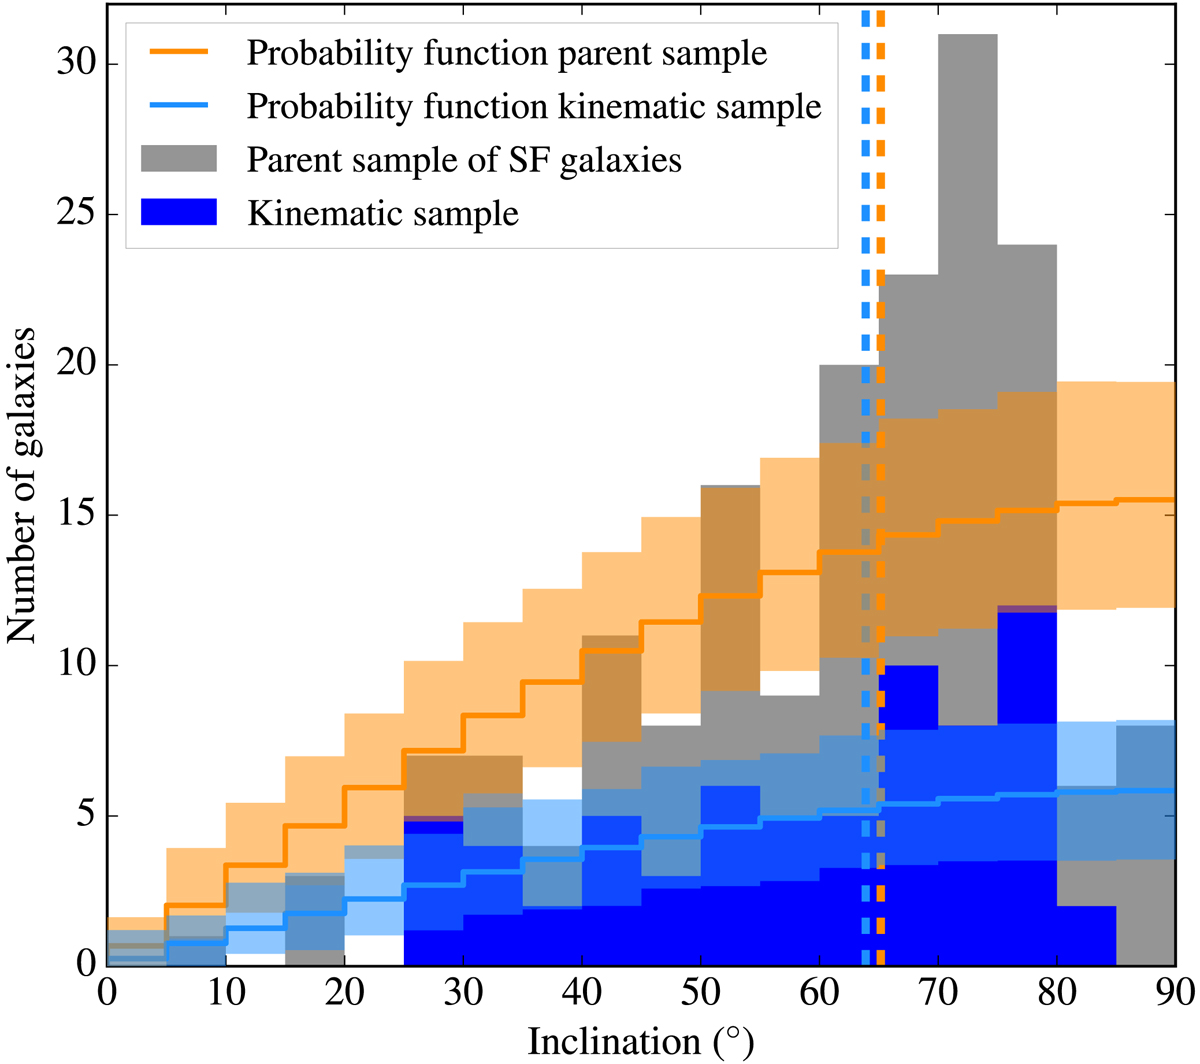
Fig. 5.

Distribution of disk inclinations for the parent sample on the main sequence of star-forming galaxies with a bin of 5° (gray). The orange curve and shadow area represent the expected theoretical distribution for random orientations and the 1σ uncertainties computed from 5000 realizations of such a random distribution with the same number of 178 galaxies as the parent sample. The distribution of the final kinematic sample (S/N > 40, Reff/FWHM > 0.5) of 67 galaxies is also displayed (filled blue histogram) along with the associated theoretical distribution and the corresponding 1σ uncertainties (light blue curve and shadow area). The dashed orange and blue vertical lines indicate the median value for the parent (i = 65.2°) and final kinematic (i = 63.9°) samples, respectively.
Current usage metrics show cumulative count of Article Views (full-text article views including HTML views, PDF and ePub downloads, according to the available data) and Abstracts Views on Vision4Press platform.
Data correspond to usage on the plateform after 2015. The current usage metrics is available 48-96 hours after online publication and is updated daily on week days.
Initial download of the metrics may take a while.


