Fig. A.1.
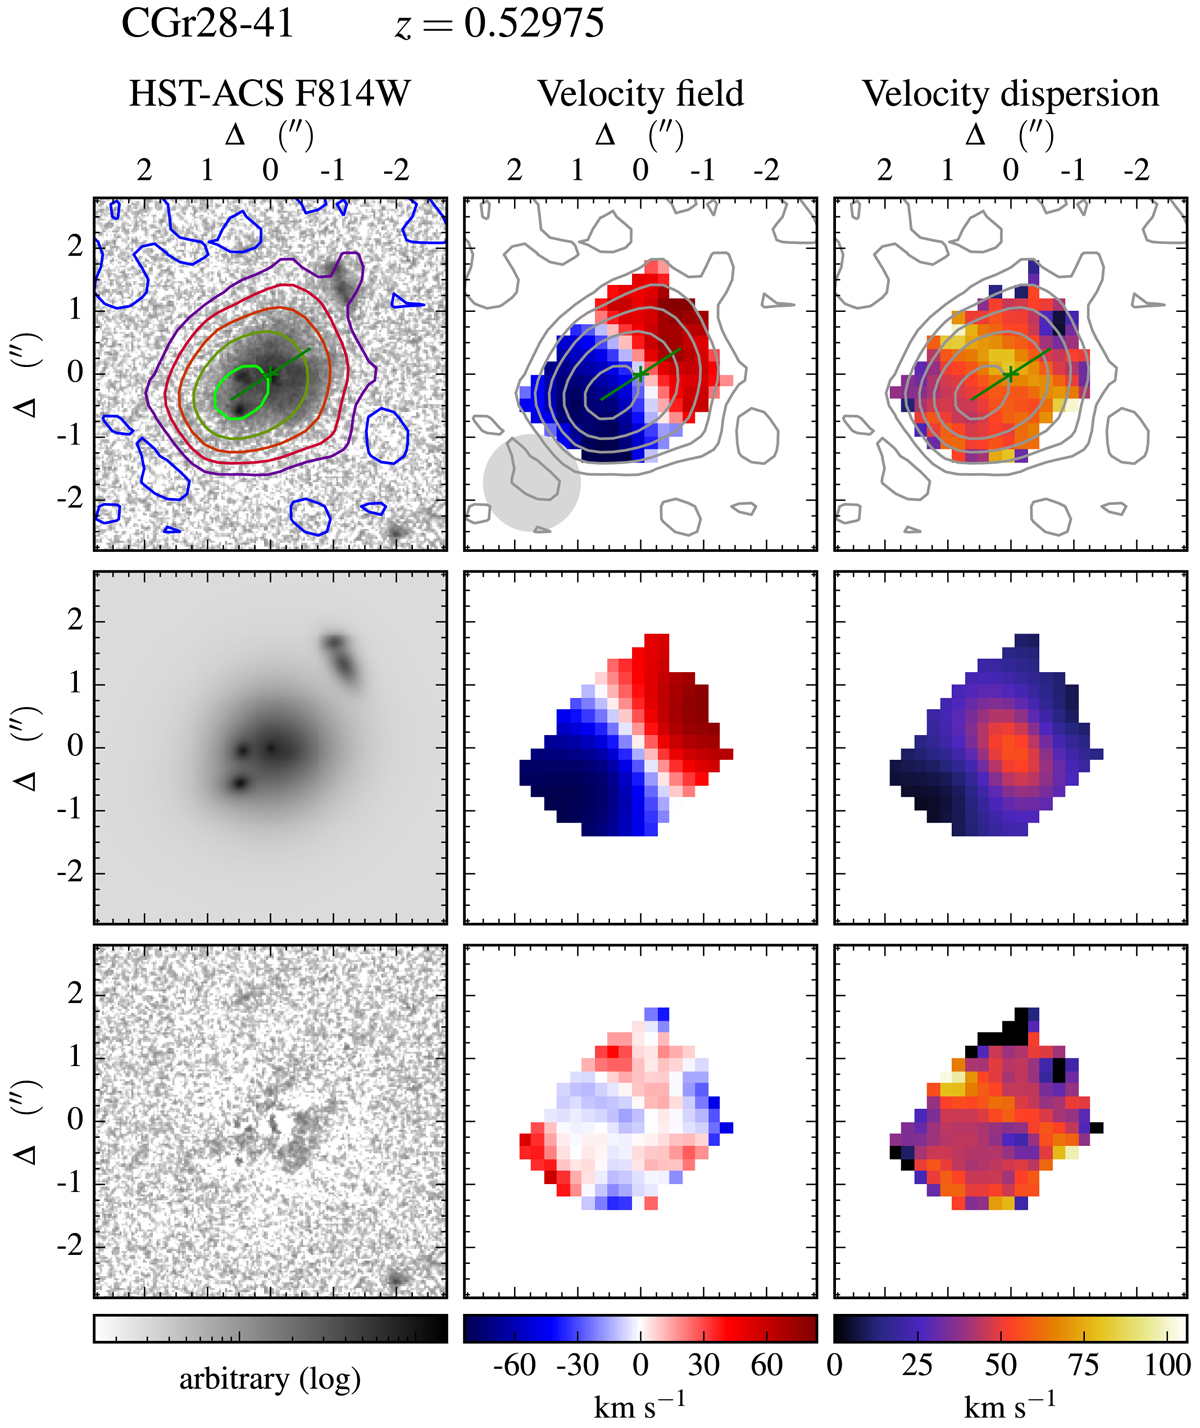
Morpho-kinematics maps for galaxy CGr28-41. Top row, from left to right: HST-ACS F814W images, MUSE velocity fields and velocity dispersion maps corrected for spectral resolution. Middle row: associated models. The velocity dispersion (third column) corresponds to a beam smearing correction map. Bottom row: residuals, except for the third column that shows the beam smearing corrected velocity dispersion map. On each observed map, the green cross indicates the center derived from the morphology, whereas the green segment indicates the kinematic major axis and has a length corresponding to R22. The [O II] flux distribution is shown with contours at levels of surface brightness Σ([O II]) = 2.5, 5.0, 10.0, 20.0, 40.0, 80.0 × 10⁻¹⁸ erg s−1 cm−2 arcsec−2. The MUSE spatial resolution is indicated with a gray disk of diameter FWHM in the bottom-left corner of the velocity field.
Current usage metrics show cumulative count of Article Views (full-text article views including HTML views, PDF and ePub downloads, according to the available data) and Abstracts Views on Vision4Press platform.
Data correspond to usage on the plateform after 2015. The current usage metrics is available 48-96 hours after online publication and is updated daily on week days.
Initial download of the metrics may take a while.