Fig. 12.
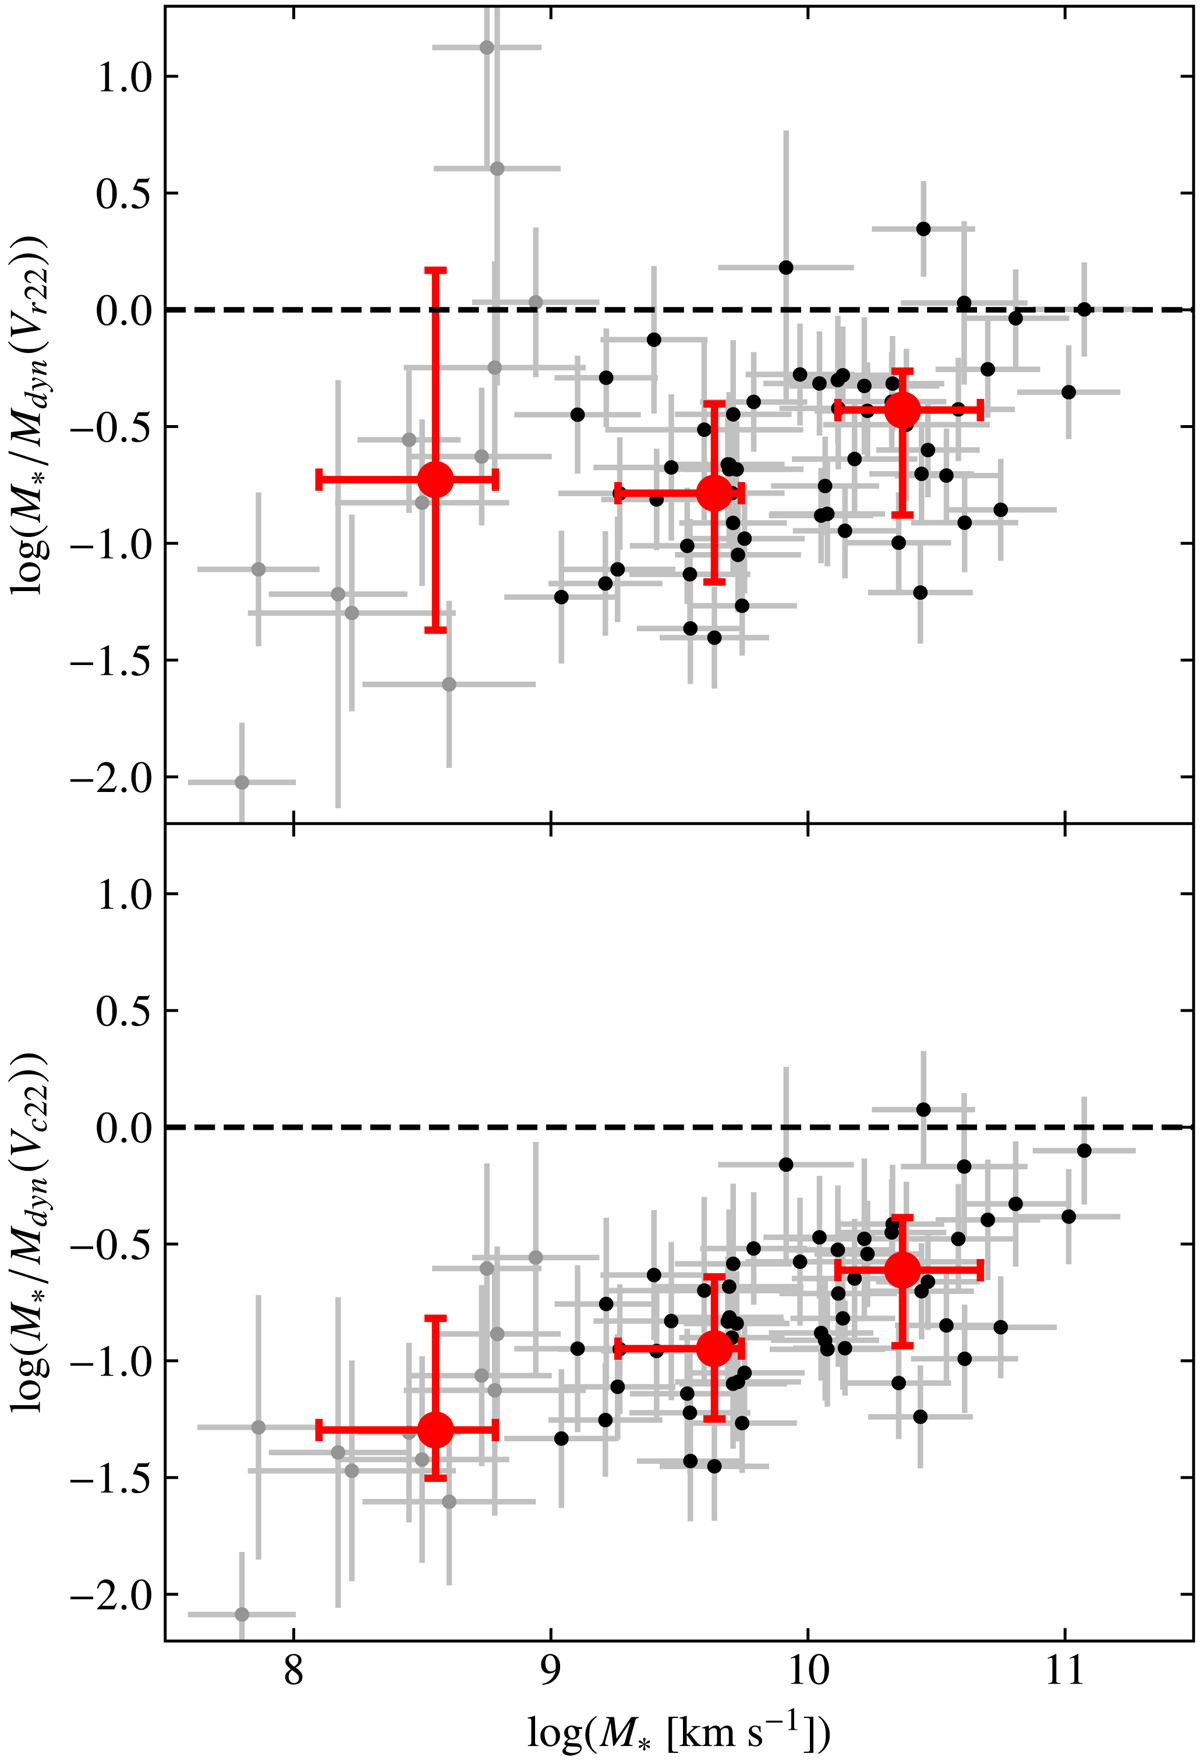
Stellar mass fraction as a function of the stellar mass, within R22. Black dots correspond to the final MAGIC kinematic sample with stellar masses above 109 M⊙, whereas the gray dots are for galaxies with masses below this limit. The black horizontal dashed line marks the theoretical upper limit of a fraction unity. The three red dots correspond to median values for the three following stellar mass bins: M* ≤ 109 M⊙, 109 M⊙ < M* ≤ 1010 M⊙ and M* > 1010 M⊙. They contain, respectively, 12, 27, and 27 galaxies. The errors bars indicate the 16th and 84th percentiles in each bin. The dynamical mass is computed either using the rotation (top) or corrected (bottom) velocities.
Current usage metrics show cumulative count of Article Views (full-text article views including HTML views, PDF and ePub downloads, according to the available data) and Abstracts Views on Vision4Press platform.
Data correspond to usage on the plateform after 2015. The current usage metrics is available 48-96 hours after online publication and is updated daily on week days.
Initial download of the metrics may take a while.