Fig. 1.
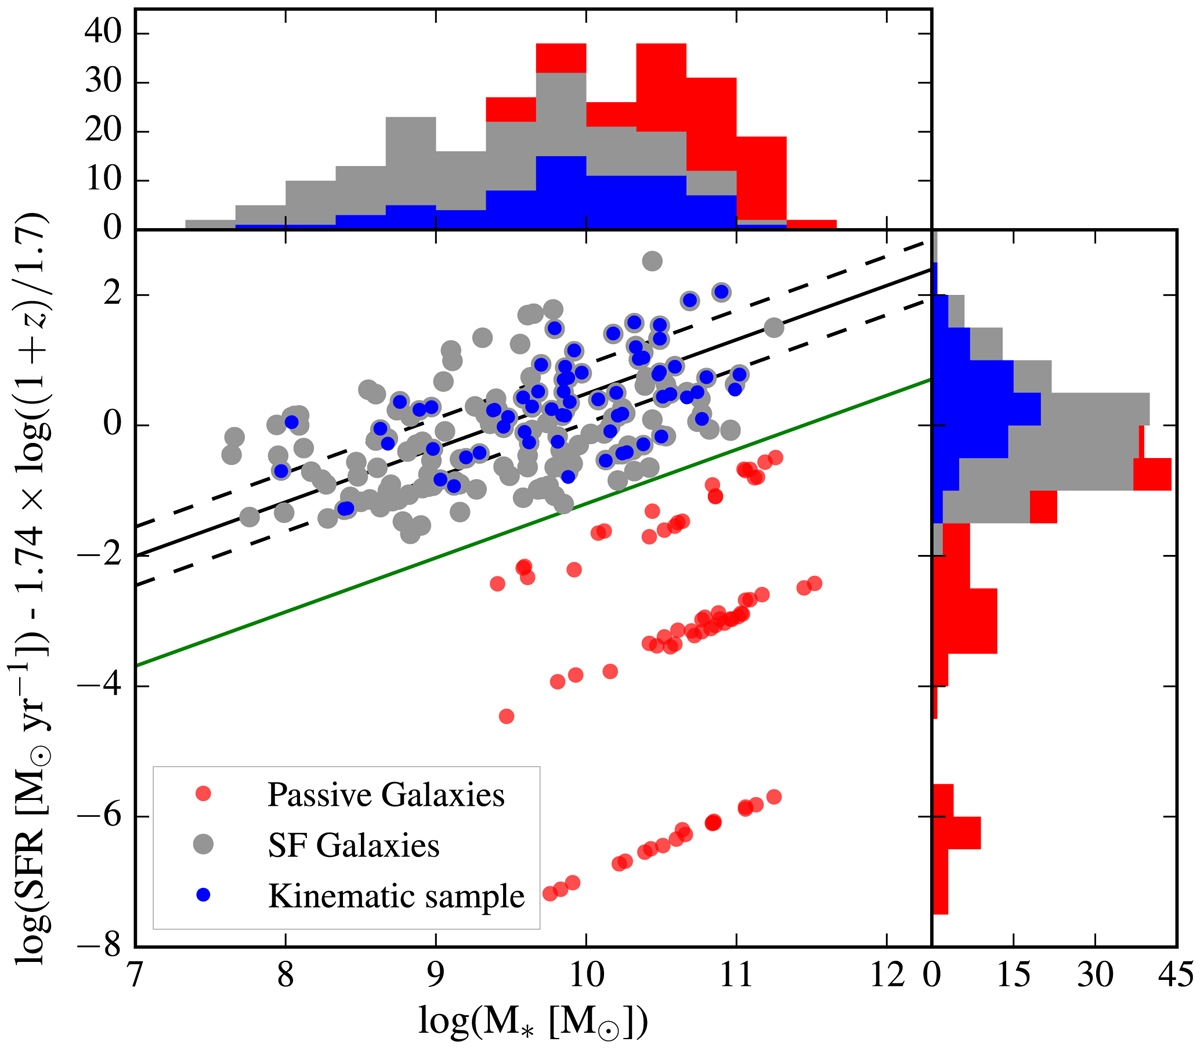
Distribution of the whole sample on the M* – SFR plane. The green line represents the separation defined in Eq. (4) used to distinguish between galaxies on the red sequence (red dots) and galaxies along the main sequence of star-forming galaxies (gray dots). The solid black line represents the best fitting of SFR – M* empirical relation for star-forming galaxies derived by Boogaard et al. (2018), with SFR normalized to redshift z = 0.7 to account for the evolution with redshift, whereas the dashed lines represent the 1-σ intrinsic scatter of this relation. Blue dots correspond to the 67 galaxies in the final kinematic sample (S/N ≥ 40, Reff/FWHM ≥ 0.5). The histograms show the stellar mass and SFR distributions for the passive galaxies (red), for the parent sample of star-forming galaxies (gray) and for the kinematic sample (blue).
Current usage metrics show cumulative count of Article Views (full-text article views including HTML views, PDF and ePub downloads, according to the available data) and Abstracts Views on Vision4Press platform.
Data correspond to usage on the plateform after 2015. The current usage metrics is available 48-96 hours after online publication and is updated daily on week days.
Initial download of the metrics may take a while.