Fig. 9
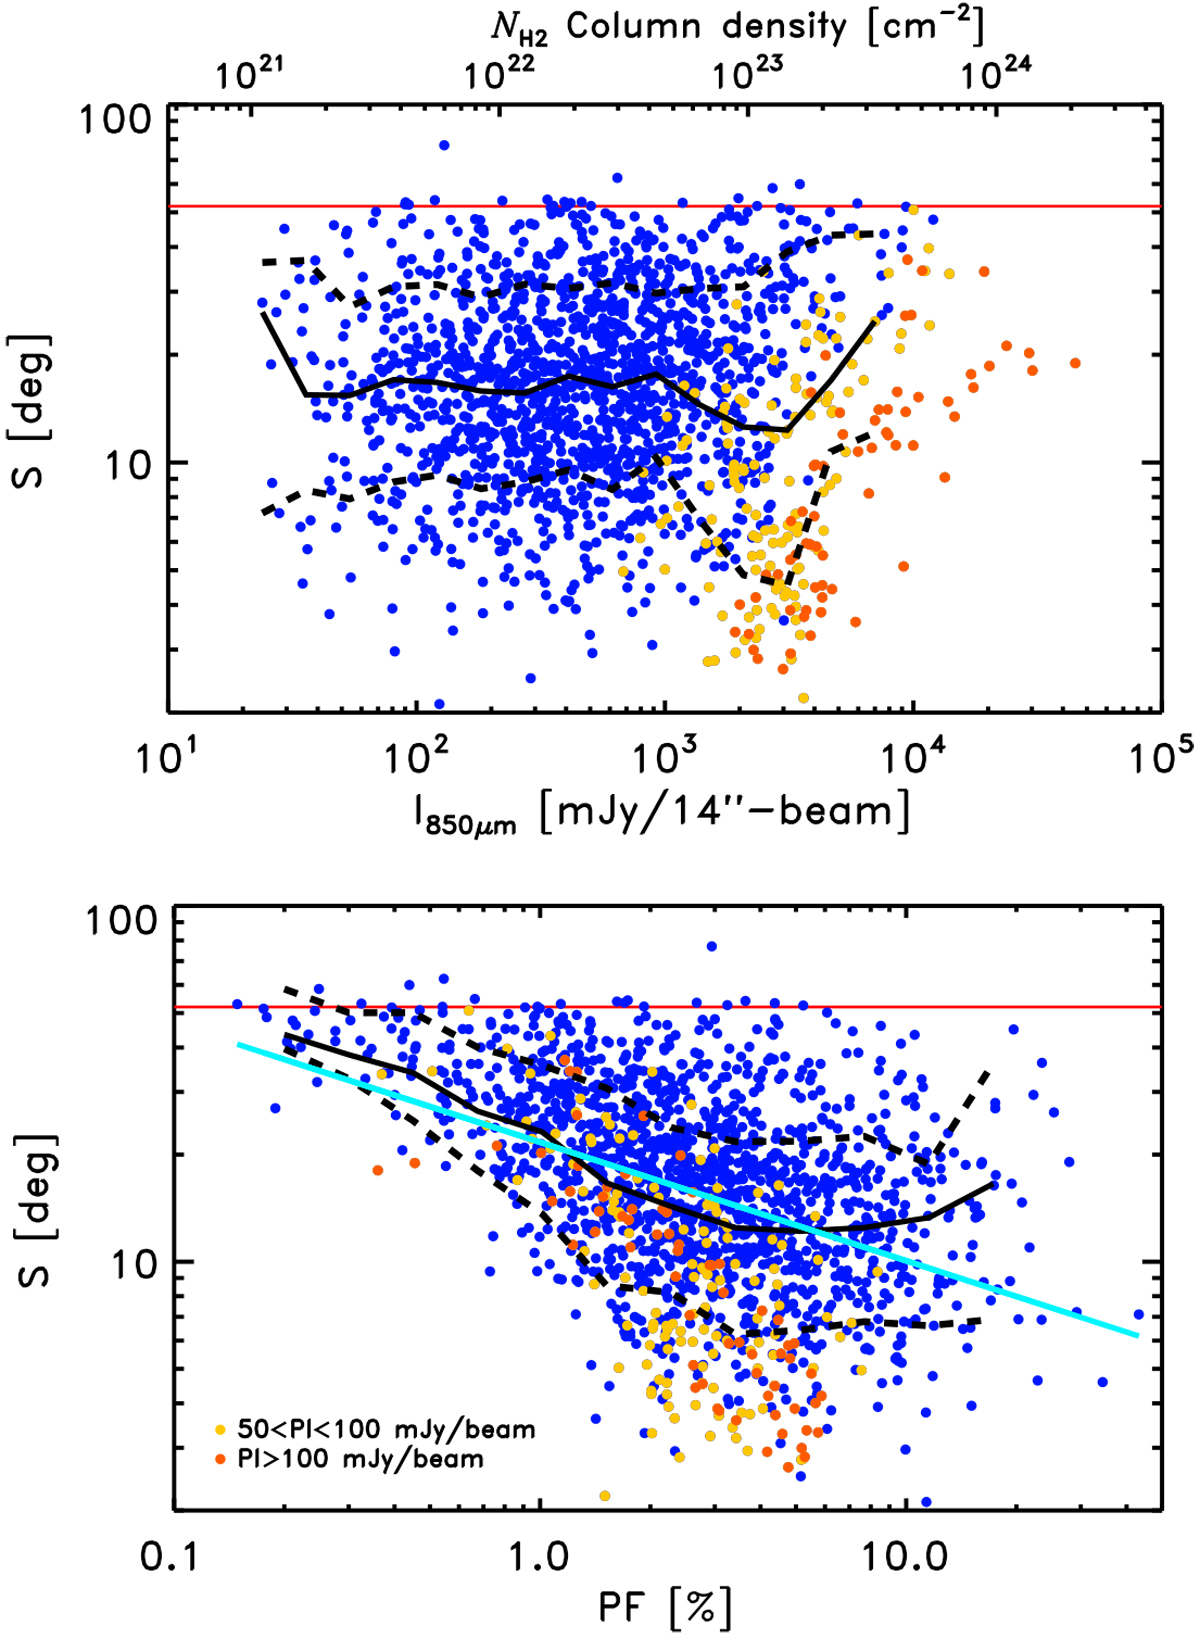
Scatter plot of S (dispersion function of ![]() ) as a functionof I
(top) and PF (bottom) for data points with SNR(I) > 25 and SNR(PI) > 3 (cf., Fig. 7). The data points with 50 < PI < 100 mJy beam−1
and PI > 100 mJy beam−1
are shown in yellow and red, respectively. The black solid curves show the median log(S) per bin of log(I) and log(PF) in the top and bottom panels, respectively. The lower and the upper dashed black lines are the
16% and 84% percentiles of the distributions, respectively. The red horizontal line at S = 52°
shows the value that S
would take for a B-field dominated by turbulence. Bottom panel: cyan solid line is a linear fit to the distribution.
) as a functionof I
(top) and PF (bottom) for data points with SNR(I) > 25 and SNR(PI) > 3 (cf., Fig. 7). The data points with 50 < PI < 100 mJy beam−1
and PI > 100 mJy beam−1
are shown in yellow and red, respectively. The black solid curves show the median log(S) per bin of log(I) and log(PF) in the top and bottom panels, respectively. The lower and the upper dashed black lines are the
16% and 84% percentiles of the distributions, respectively. The red horizontal line at S = 52°
shows the value that S
would take for a B-field dominated by turbulence. Bottom panel: cyan solid line is a linear fit to the distribution.
Current usage metrics show cumulative count of Article Views (full-text article views including HTML views, PDF and ePub downloads, according to the available data) and Abstracts Views on Vision4Press platform.
Data correspond to usage on the plateform after 2015. The current usage metrics is available 48-96 hours after online publication and is updated daily on week days.
Initial download of the metrics may take a while.