Fig. 5
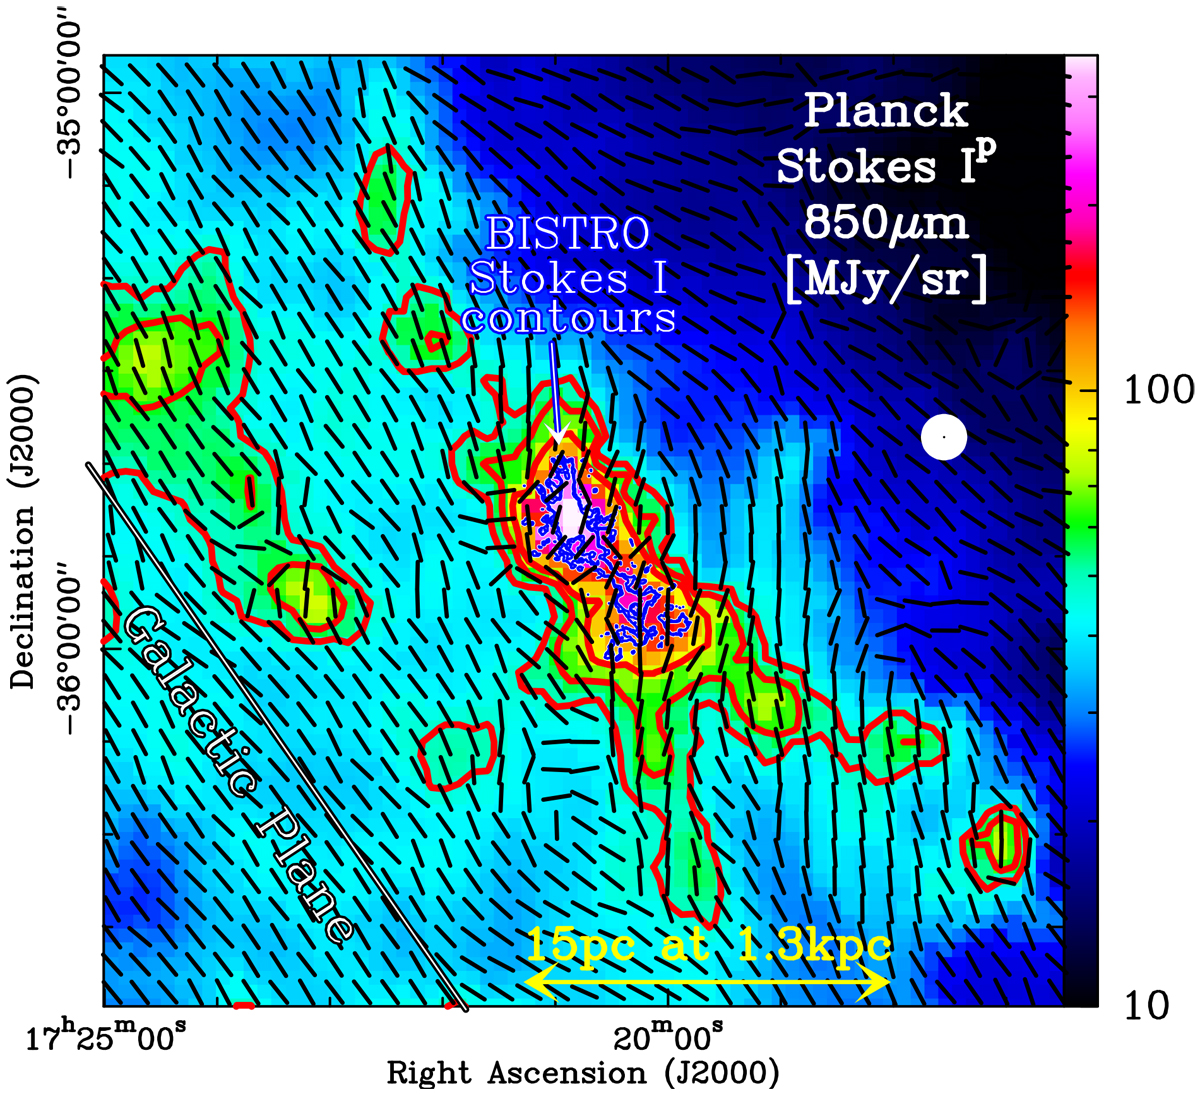
Planck total intensity Ip map of the 850 μm emission toward NGC 6334. The red contours show the Planck intensity at Ip ~ 48, 60, and 80 MJy sr−1 (at 5′ resolution) and the blue contour the BISTRO intensity 0.4 Jy/14′′-beam or 75 MJy sr−1 (at 14′′ resolution). The black lines are the POS B-field angles derived from Planck data at the resolution of 5′. The Planck (5′) and BISTRO (14′′) beams are shown on the right hand side of the plot as concentric filled white and black circles, respectively. The Galactic Plane is also indicated.
Current usage metrics show cumulative count of Article Views (full-text article views including HTML views, PDF and ePub downloads, according to the available data) and Abstracts Views on Vision4Press platform.
Data correspond to usage on the plateform after 2015. The current usage metrics is available 48-96 hours after online publication and is updated daily on week days.
Initial download of the metrics may take a while.